Based on the time series data presented above, do the forecasts using 2-month moving average (2-MA) and single exponential smoothing (SES) with a = 0.4, and answer the following questions: (i) What is the mean absolute deviation (MAD) for 2-MA? (ii) What is the mean absolute deviation (MAD) for SES a = 0.4 ? (iii) Based on what you got, which method is more accurate?
Based on the time series data presented above, do the forecasts using 2-month moving average (2-MA) and single exponential smoothing (SES) with a = 0.4, and answer the following questions: (i) What is the mean absolute deviation (MAD) for 2-MA? (ii) What is the mean absolute deviation (MAD) for SES a = 0.4 ? (iii) Based on what you got, which method is more accurate?

Practical Management Science
6th Edition
ISBN:9781337406659
Author:WINSTON, Wayne L.
Publisher:WINSTON, Wayne L.
Chapter13: Regression And Forecasting Models
Section13.7: Exponential Smoothing Models
Problem 26P: The file P13_26.xlsx contains the monthly number of airline tickets sold by the CareFree Travel...

Related questions
Question
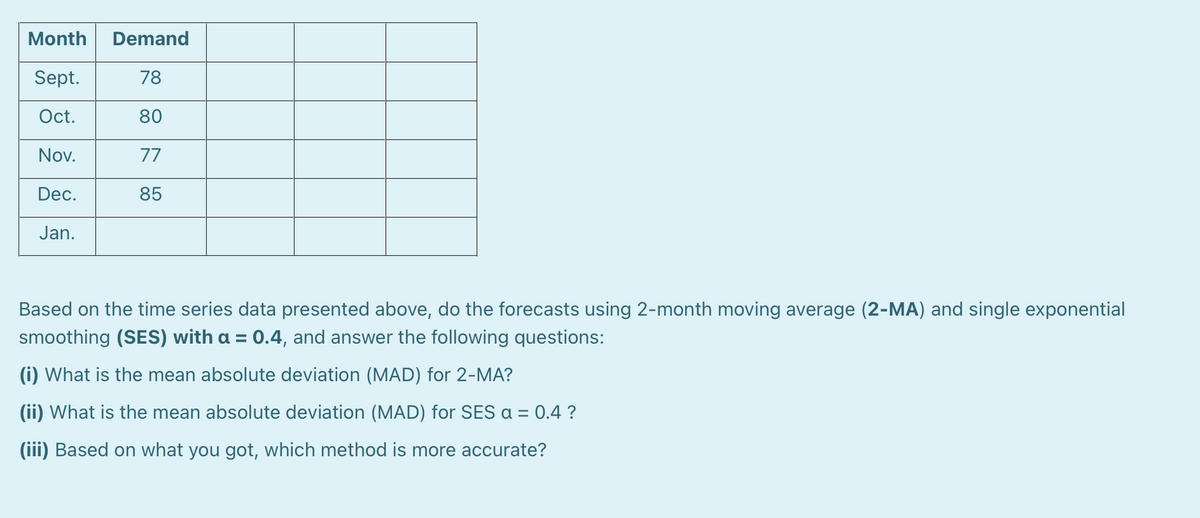
Transcribed Image Text:Month
Demand
Sept.
78
Oct.
80
Nov.
77
Dec.
85
Jan.
Based on the time series data presented above, do the forecasts using 2-month moving average (2-MA) and single exponential
smoothing (SES) with a = 0.4, and answer the following questions:
%3D
(i) What is the mean absolute deviation (MAD) for 2-MA?
(ii) What is the mean absolute deviation (MAD) for SES a = 0.4 ?
(iii) Based on what you got, which method is more accurate?
Expert Solution
This question has been solved!
Explore an expertly crafted, step-by-step solution for a thorough understanding of key concepts.

This is a popular solution!

Trending now
This is a popular solution!

Step by step
Solved in 3 steps with 2 images

Recommended textbooks for you
Practical Management Science
Operations Management
ISBN:
9781337406659
Author:
WINSTON, Wayne L.
Publisher:
Cengage,

Contemporary Marketing
Marketing
ISBN:
9780357033777
Author:
Louis E. Boone, David L. Kurtz
Publisher:
Cengage Learning

Marketing
Marketing
ISBN:
9780357033791
Author:
Pride, William M
Publisher:
South Western Educational Publishing
Practical Management Science
Operations Management
ISBN:
9781337406659
Author:
WINSTON, Wayne L.
Publisher:
Cengage,
Contemporary Marketing
Marketing
ISBN:
9780357033777
Author:
Louis E. Boone, David L. Kurtz
Publisher:
Cengage Learning
Marketing
Marketing
ISBN:
9780357033791
Author:
Pride, William M
Publisher:
South Western Educational Publishing