Consider the following set of time series sales data for a growing company over the past 8 months: Month Sales 1 15 13 3 18 4 22 20 23 7 22 21
Q: Weekly sales of copy paper at Cubicle Suppliers are in the table below. Compute a three- period…
A: This question is related to the topic -Forecasting and this topic would fall under the business…
Q: Demand for oil changes at Garcia’s Garage has been as follows:Month Number of Oil…
A: The following dialogue box will appear. Enter the data and click on OK.
Q: Series forecasting for Business| The F-test used in testing the significance of a regression model…
A: The correct answer is
Q: Consider the following time series data: Week 1 2 3 4 5 6 Value 18 13 16 11 17…
A: The concept used here is forecasting with Moving averages and forecast evaluation using MAE, MSE and…
Q: Week Actual Forecast Demand 1 52 48 2 42 46 3 56 52 4 45 47 true or false Assume that the actual…
A: The table shows the calculation of forecast of demand using the simple moving average method with 3…
Q: Consider the following time series data. Month 1 2 3 4 5 6…
A: MSE stands for Mean squared error. It calculates the average squared difference between the forecast…
Q: Using an exponential smoothing model with an alpha value of 0.20, estimate the smoothed value…
A: The answer is as below:
Q: Sales of tablet computers at Ted Glickman's electronics store in Washington, D.C., over the past 10…
A: Exponential Smoothing is a hugely familiar system to provide a smoothed time series. In the single…
Q: Sales of tablet computers at Ted Glickman's electronics store in Washington, D.C., over the past 10…
A: Error = Actual Demand - Forecast Absolute Error = Positive value of Error MAD = Average of…
Q: Develop a forecast for the fourth quarter using a three-quarter, weighted moving average. Weight the…
A: In the given data, actual sales are presented over the past 21 months, There are four quarters in…
Q: Construct a time series plot. What type of pattern exists? Develop a…
A: Solution 1. The time series plot is constructed by taking sales data on Y - axis and months on…
Q: Period 1 2 3 4 6. 7 8 9 10 11 12 Sales 568 604 645 742 661 606 749 680 704 736 660 756
A:
Q: The demand (in number of units) for Apple iPad over the past 6 months at BestBuy is summarized…
A: 2-month weighted moving average: Formula: Answer:
Q: The following equation summarizes the trend portion of quarterly sales of condominiums over a long…
A: Forecasting is a method that produces accurate estimates using historical data as inputs to…
Q: 9. a. Obtain the linear trend equation for the following data on new checking accounts at Fair Sav…
A: A trend line is a finest fit straight-line cast-off through liner data sets which support to…
Q: Obtain the linear trend equation for the following data on new checking accounts at Fair Savings…
A: Linear trend equation is given by: y = a+bx here, a = intercept and b = slope Formulas used: a = ∑y…
Q: The plot of the time series helps to decide about the best model to be used for forecasting O a True…
A: Th answer for the above question is as follows:
Q: snip
A: An exponential smoothing forecast becomes more responsive to changes in a data series when its alpha…
Q: Harlen Industries Limited has a simple forecasting model whose forecast demand has been plotted…
A: In this question, we have the table data for an 8 periods duration, for each period, we have actual…
Q: The data below represents the quarterly changes in demand for a product over the next 3 months.…
A: Given data is
Q: A manufacturer of printed circuit boards uses exponentialsmoothing with trend to forecast monthly…
A: The image given in step 2 gives a detailed solution of the question that has been asked.
Q: Registration numbers for an accounting seminar over the past I 0 weeks are shown below:…
A: Note: “Since you have posted a question with multiple sub-parts, we will solve the first three…
Q: Forecasts based on averages. Given the following data:PeriodNumber ofComplaints1 602 653 554 585…
A: Formula: Answer:
Q: Given that the previous forecast of 65 turnedout to be four units less than the actual demand; the…
A: In simple exponential smoothing method, forecast for period t can be calculated using the following…
Q: The following is the Forecasting model for a FOUR season product; the model has been in use since…
A: Regression Analysis Method: The advantage of regression analysis is that it does not consider only…
Q: Consider the following time series data. 2 3 4 5 6 Week 1 Value 19 12 14 10 16 13 (a) Construct a…
A: 3-period moving average forecast (Ft)= At-1+At-2+At-33 Exponential smoothing Forecast…
Q: Consider the total production (and sales) of ice cream in Canada (in millions of liters) for the…
A: Since we only answer up to 3 sub-parts, we will answer the first 3. Please resubmit the question and…
Q: Ordinary least squares technique or linear regression analysis
A: THE ANSWER IS AS BELOW:
Q: The manager of a travel agency has been using a seasonally adjusted forecast to predict demand for…
A: Mean absolute deviation determines the prediction's accuracy by averaging the specified inaccuracy…
Q: The following are the sales figures for 2018 through 2020 for a product. Data for a year is…
A: An exponential forecasting technique can be expanded to support data with a systematic trend or…
Q: d. Follow part (b) above but using an alpha of 0.8 this time. Discuss the forecasting errors…
A: Absolute error is the error between the forecasted value and the actual value of the set.
Q: My problem asks me to Forecast using a "simple 4-month moving average" but when I calcualte that, I…
A: A) Month Units Sold May 1500 June 1400 July 1800 August 1500…
Q: a. Forecast April through September using a three-month moving average. b. Use simple exponential…
A: Below is the solution:-
Q: Forecasting is a prediction rather than a reality
A: The term forecasting is a technique that uses the historical data as inputs to make the informed…
Q: Consider the following time series data. Choose the correct time series plot. (i) (ii)…
A: A time series is a grouping of information focuses that happen in progressive requests throughout…
Q: A company sells wielding generators. The demand for periods 1 to 9 is 44,52,50,,54,55,55,60, 56 and…
A: THE ANSWER IS AS FOLLOWS:
Q: The actual number of patients at Providence Emergency Medical Clinic for the first six weeks of this…
A: The weighted moving averages (WMA) are accomplished by multiplying every quantity in the data set…
Q: 2. Simple moving average using Excel: Calculate demand forecast for weeks 6-20 using 5 week simple…
A: Forecasting is predicting the demand/sales in advance for future periods. Moving average forecast is…
Q: The forecast for Monday was derived by observing Monday's demand level and setting Monday's forecast…
A: WE ARE GIVEN WITH ACTUAL DEMAND AND FORECAST DEMAND OF MONDAY TO THURSDAY. WE ARE TO FIND FORECAST…
Q: A forecast is usually classified by the future time horizon that it covers. True or false? Describe…
A: This statement is true because- Forecasts are classified according to time, use and period.…
Q: Consider the following actual and forecast demand levels for Big Mac hamburgers at a local…
A: Let, Ft+1 = Forecast for friday Yt = 48.00 Ft = 77.60 α = 0.40 Thus expression for the forecast for…
Q: Mark Gershon, owner of a musical instrument distributorship, thinks that demand for guitars may be…
A: Using least Square method Marron 5 TV appearancr(X) Demand for Guitars(Y X^2 Y^2 XY 3 4 9 16…
Q: Use the following information to compute a single exponential smoothing model forecast with a…
A: From the above information, Let, Forecast for period 1 =f1 =115 Actual value for period 1 =a1…
Q: Consider the following set of time series sales data for a growing company over the past 8 months:…
A: Formula: Answer:
Q: The actual demand for the patients at EYE OPD of KTH for the first six weeks of this year follows…
A: Given data is
Q: The problem below looks at forecasting methodologies to determine which forecasting model results in…
A: Formulae: For 3 period moving average (SMA) Simple moving average(Ft) = At-1+At-2+At-33Weighted…
Q: You have been assigned to forecast the number of aircraft engines ordered each month by Commins…
A: Note: - In the given question alpha value is 0.3 instead of typing mistake 'a 5 0.3'. Given data is…
Q: Assuming a forecast for Week 2 of 48 cases (f2 = 48), generate forecasts for Weeks 13 using…
A: The exponential smoothing forecasting method is a statistical technique for estimating future values…
Q: A time series with forecast values and error terms is presented in the following table. The mean…
A: Following table shows the calcuations: Month Actual, Yt Forecast, Ft Error |Yt-Ft|/Yt July 5…
- Construct a time series plot. What type of pattern exists?
- Develop a
forecast for the next month using the averaging method. - Develop a forecast for the next month using the naïve last-value method.
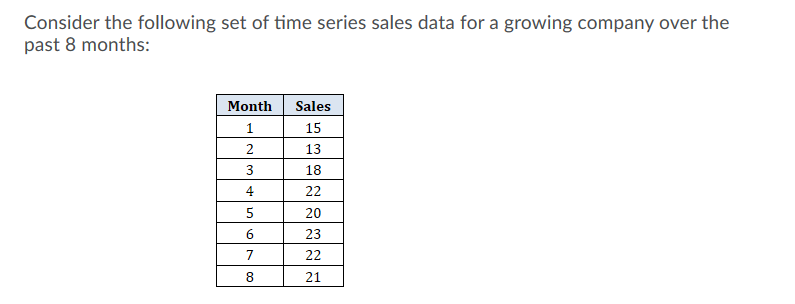
Trending now
This is a popular solution!
Step by step
Solved in 3 steps with 5 images
- The management of a technology company is trying to determine the variable that best explains the variation of employee salaries using a sample of 52 full-time employees; see the file P13_08.xlsx. Estimate simple linear regression equations to identify which of the following has the strongest linear relationship with annual salary: the employees gender, age, number of years of relevant work experience prior to employment at the company, number of years of employment at the company, or number of years of post secondary education. Provide support for your conclusion.Management of a home appliance store wants to understand the growth pattern of the monthly sales of a new technology device over the past two years. The managers have recorded the relevant data in the file P13_05.xlsx. Have the sales of this device been growing linearly over the past 24 months? By examining the results of a linear trend line, explain why or why not.A trucking company wants to predict the yearly maintenance expense (Y) for a truck using the number of miles driven during the year (X1) and the age of the truck (X2, in years) at the beginning of the year. The company has gathered the data given in the file P13_13.xlsx. Note that each observation corresponds to a particular truck. Estimate a multiple regression equation using the given data. Interpret each of the estimated regression coefficients. Also, interpret the standard error of estimate and the R-square value for these data.
- The file P13_25.xlsx contains the quarterly numbers of applications for home mortgage loans at a branch office of Northern Central Bank. a. Create a time series chart of the data. Based on what you see, which of the exponential smoothing models do you think will provide the best forecasting model? Why? b. Use simple exponential smoothing to forecast these data, using a smoothing constant of 0.1. c. Repeat part b, but search for the smoothing constant that makes RMSE as small as possible. Does it make much of an improvement over the model in part b? Is it guaranteed to produce better forecasts for the future?The file P13_29.xlsx contains monthly time series data for total U.S. retail sales of building materials (which includes retail sales of building materials, hardware and garden supply stores, and mobile home dealers). a. Is seasonality present in these data? If so, characterize the seasonality pattern. b. Use Winters method to forecast this series with smoothing constants = = 0.1 and = 0.3. Does the forecast series seem to track the seasonal pattern well? What are your forecasts for the next 12 months?Do the sales prices of houses in a given community vary systematically with their sizes (as measured in square feet)? Answer this question by estimating a simple regression equation where the sales price of the house is the dependent variable, and the size of the house is the explanatory variable. Use the sample data given in P13_06.xlsx. Interpret your estimated equation, the associated R-square value, and the associated standard error of estimate.
- The file P13_26.xlsx contains the monthly number of airline tickets sold by the CareFree Travel Agency. a. Create a time series chart of the data. Based on what you see, which of the exponential smoothing models do you think will provide the best forecasting model? Why? b. Use simple exponential smoothing to forecast these data, using a smoothing constant of 0.1. c. Repeat part b, but search for the smoothing constant that makes RMSE as small as possible. Does it make much of an improvement over the model in part b?Management of a home appliance store would like to understand the growth pattern of the monthly sales of Blu-ray disc players over the past two years. Managers have recorded the relevant data in the file P13_33.xlsx. a. Create a scatterplot for these data. Comment on the observed behavior of monthly sales at this store over time. b. Estimate an appropriate regression equation to explain the variation of monthly sales over the given time period. Interpret the estimated regression coefficients. c. Analyze the estimated equations residuals. Do they suggest that the regression equation is adequate? If not, return to part b and revise your equation. Continue to revise the equation until the results are satisfactory.The file P13_28.xlsx contains monthly retail sales of U.S. liquor stores. a. Is seasonality present in these data? If so, characterize the seasonality pattern. b. Use Winters method to forecast this series with smoothing constants = = 0.1 and = 0.3. Does the forecast series seem to track the seasonal pattern well? What are your forecasts for the next 12 months?
- The file P13_19.xlsx contains the weekly sales of a particular brand of paper towels at a supermarket for a one-year period. a. Using a span of 3, forecast the sales of this product for the next 10 weeks with the moving averages method. How well does this method with span 3 forecast the known observations in this series? b. Repeat part a with a span of 10. c. Which of these two spans appears to be more appropriate? Justify your choice.The file P13_22.xlsx contains total monthly U.S. retail sales data. While holding out the final six months of observations for validation purposes, use the method of moving averages with a carefully chosen span to forecast U.S. retail sales in the next year. Comment on the performance of your model. What makes this time series more challenging to forecast?The file P13_02.xlsx contains five years of monthly data on sales (number of units sold) for a particular company. The company suspects that except for random noise, its sales are growing by a constant percentage each month and will continue to do so for at least the near future. a. Explain briefly whether the plot of the series visually supports the companys suspicion. b. By what percentage are sales increasing each month? c. What is the MAPE for the forecast model in part b? In words, what does it measure? Considering its magnitude, does the model seem to be doing a good job? d. In words, how does the model make forecasts for future months? Specifically, given the forecast value for the last month in the data set, what simple arithmetic could you use to obtain forecasts for the next few months?