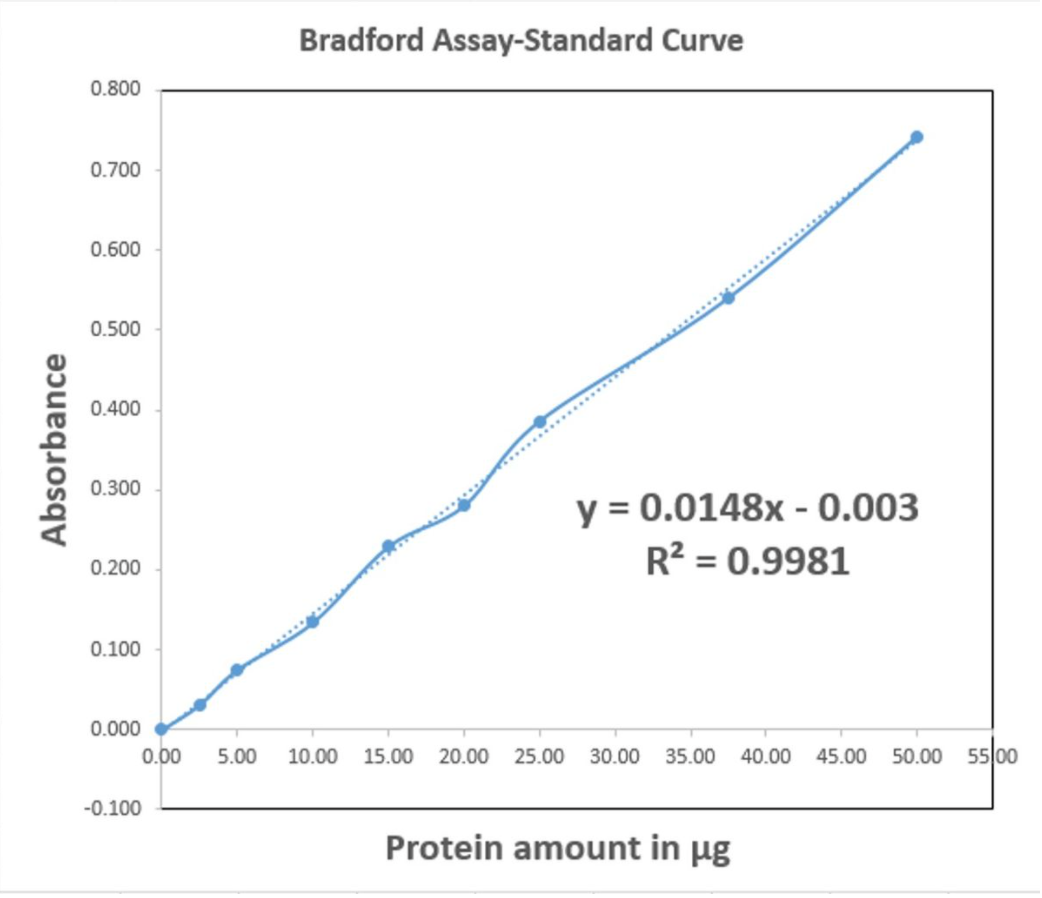
Bradford Assay-Standard Curve 0.800 0.700 0.600 0.500 0.400 0.300 y = 0.0148x - 0.003 R? = 0.9981 0.200 0.100 0.000 0.00 5.00 10.00 15.00 20.00 25.00 30.00 35.00 40.00 45.00 50.00 55 00 -0.100 Protein amount in µg Absorbance
The purification of cytochrome C begins with 1) yeast homogenization using a bead beater in the presence of BME (a reducing agent) and a protease inhibitor from approximately 900 grams of Baker’s yeast. Then, 2) insoluble cell contents were removed by centrifugation at 4,000 x g for approximately ten minutes. The ruptured cells (lysate) after centrifugation had a total volume of 0 mL and a 1.0 mL aliquot was set aside for further analysis. The following data was obtained from the 1.0 mL aliquot to quantify the protein amount and purity:
- The absorbance at 410 nm of the aliquot was 0.460 (1 cm pathlength).
- The absorbance at 595 nm from a 1.0 mL Bradford Assay solution that was diluted by 250-fold from the aliquot was 0.681 (1 cm pathlength).
Using the information given,
- Calculate the total protein amount in mg from the absorbance at 595 nm.
- Calculate the cytochrome C amount in mg from the absorbance at 410 nm using Beer’s Law.


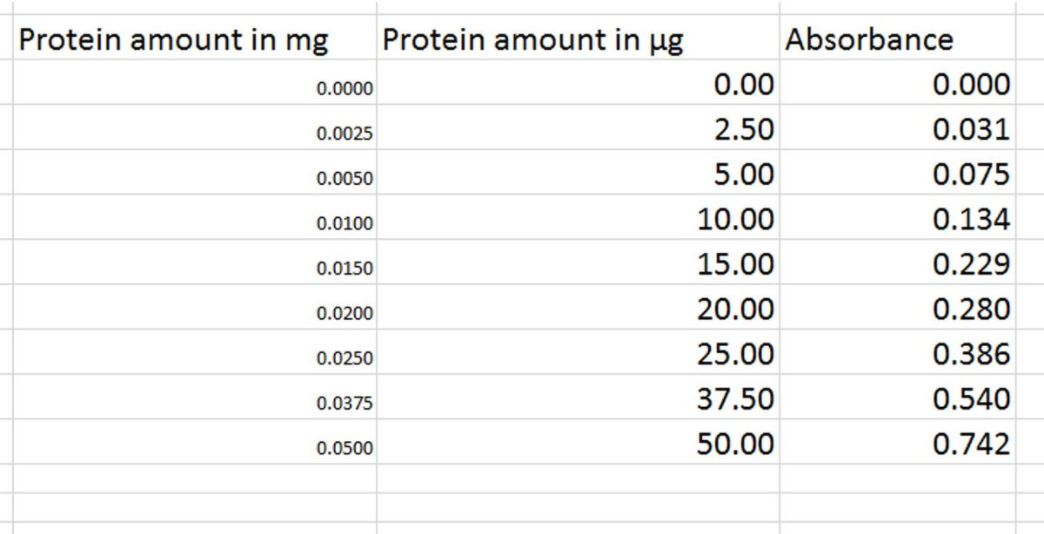
Spectrophotometric analysis can be carried out to find the concentration (or amount) of protein in a sample. To find the concentration (or amount) of protein in our sample, first we need to draw a standard curve using known concentrations of protein and the absorbance values at those concentrations. Then we generate a trendline (the dotted blue line in the Bradford assay-standard curve) and generate the equation the line. The general equation of a line is ' y= mx + c ' .
Here;
'y' is the Y-axis value ( Absorbance at 595nm in the Bradford assay-standard curve)
'x' is the X-axis value ( amount of protein in in the Bradford assay-standard curve)
'm' is the slope
'c' is the Y-intercept.
Trending now
This is a popular solution!
Step by step
Solved in 3 steps


