Bruxism is excessive grinding of the teeth or clenching of the jaw. It can lead to tooth wear, tooth mobility, hypersensitivity, aching jaw muscles, and headaches. Occlusal splints, commonly called bite guards, can be prescribed to reduce wear on teeth. In a clinical study of occlusal splints in the treatment of childhood bruxism, Restrepo et al. used a nondimensional measure called the D factor (the ratio of the square root of the area to the perimeter) to evaluate the form of dental wear. The 34 subjects ranged in age from three to six years old. The researchers randomly assigned 20 and 14 children to the experimental and control groups, respectively. Assume that the researchers randomly recruited all subjects from a population with a normally distributed D factor. Because they drew all subjects from the same population, the researchers assumed that the variances would be equal for each group. The mean baseline D factor for the experimental group'was 13.35; the mean baseline D factor for the control group was 10.91. For each group, the sample standard deviation of the D factor was 2.51. Select the appropriate distribution to test for the difference between the two means. Ot-distribution with 32 degrees of freedom t-distribution with 33 degrees of freedom t-distribution with 13 degrees of freedom Ot-distribution with 28.1 degrees of freedom
Bruxism is excessive grinding of the teeth or clenching of the jaw. It can lead to tooth wear, tooth mobility, hypersensitivity, aching jaw muscles, and headaches. Occlusal splints, commonly called bite guards, can be prescribed to reduce wear on teeth. In a clinical study of occlusal splints in the treatment of childhood bruxism, Restrepo et al. used a nondimensional measure called the D factor (the ratio of the square root of the area to the perimeter) to evaluate the form of dental wear. The 34 subjects ranged in age from three to six years old. The researchers randomly assigned 20 and 14 children to the experimental and control groups, respectively. Assume that the researchers randomly recruited all subjects from a population with a normally distributed D factor. Because they drew all subjects from the same population, the researchers assumed that the variances would be equal for each group. The mean baseline D factor for the experimental group'was 13.35; the mean baseline D factor for the control group was 10.91. For each group, the sample standard deviation of the D factor was 2.51. Select the appropriate distribution to test for the difference between the two means. Ot-distribution with 32 degrees of freedom t-distribution with 33 degrees of freedom t-distribution with 13 degrees of freedom Ot-distribution with 28.1 degrees of freedom

MATLAB: An Introduction with Applications
6th Edition
ISBN:9781119256830
Author:Amos Gilat
Publisher:Amos Gilat
Chapter1: Starting With Matlab
Section: Chapter Questions
Problem 1P

Related questions
Question
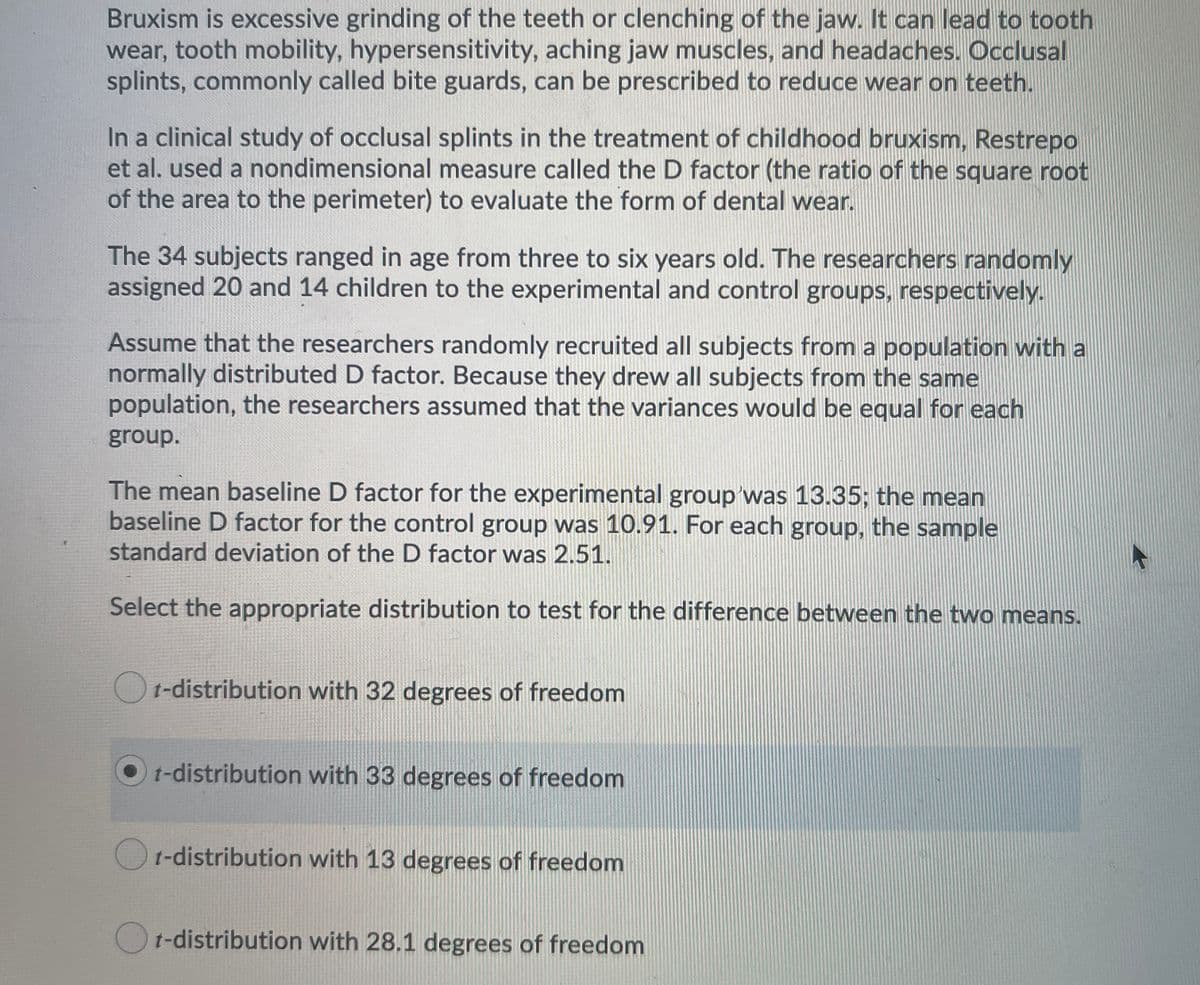
Transcribed Image Text:Bruxism is excessive grinding of the teeth or clenching of the jaw. It can lead to tooth
wear, tooth mobility, hypersensitivity, aching jaw muscles, and headaches. Occlusal
splints, commonly called bite guards, can be prescribed to reduce wear on teeth.
In a clinical study of occlusal splints in the treatment of childhood bruxism, Restrepo
et al. used a nondimensional measure called the D factor (the ratio of the square root
of the area to the perimeter) to evaluate the form of dental wear.
The 34 subjects ranged in age from three to six years old. The researchers randomly
assigned 20 and 14 children to the experimental and control groups, respectively.
Assume that the researchers randomly recruited all subjects from a population with a
normally distributed D factor. Because they drew all subjects from the same
population, the researchers assumed that the variances would be equal for each
group.
The mean baseline D factor for the experimental group'was 13.35; the mean
baseline D factor for the control group was 10.91. For each group, the sample
standard deviation of the D factor was 2.51.
Select the appropriate distribution to test for the difference between the two means.
Or-distribution with 32 degrees of freedom
t-distribution with 33 degrees of freedom
O t-distribution with 13 degrees of freedom
Ot-distribution with 28,1 degrees of freedom
Expert Solution
This question has been solved!
Explore an expertly crafted, step-by-step solution for a thorough understanding of key concepts.

Step by step
Solved in 2 steps

Recommended textbooks for you
MATLAB: An Introduction with Applications
Statistics
ISBN:
9781119256830
Author:
Amos Gilat
Publisher:
John Wiley & Sons Inc

Probability and Statistics for Engineering and th…
Statistics
ISBN:
9781305251809
Author:
Jay L. Devore
Publisher:
Cengage Learning

Statistics for The Behavioral Sciences (MindTap C…
Statistics
ISBN:
9781305504912
Author:
Frederick J Gravetter, Larry B. Wallnau
Publisher:
Cengage Learning
MATLAB: An Introduction with Applications
Statistics
ISBN:
9781119256830
Author:
Amos Gilat
Publisher:
John Wiley & Sons Inc
Probability and Statistics for Engineering and th…
Statistics
ISBN:
9781305251809
Author:
Jay L. Devore
Publisher:
Cengage Learning
Statistics for The Behavioral Sciences (MindTap C…
Statistics
ISBN:
9781305504912
Author:
Frederick J Gravetter, Larry B. Wallnau
Publisher:
Cengage Learning

Elementary Statistics: Picturing the World (7th E…
Statistics
ISBN:
9780134683416
Author:
Ron Larson, Betsy Farber
Publisher:
PEARSON

The Basic Practice of Statistics
Statistics
ISBN:
9781319042578
Author:
David S. Moore, William I. Notz, Michael A. Fligner
Publisher:
W. H. Freeman

Introduction to the Practice of Statistics
Statistics
ISBN:
9781319013387
Author:
David S. Moore, George P. McCabe, Bruce A. Craig
Publisher:
W. H. Freeman