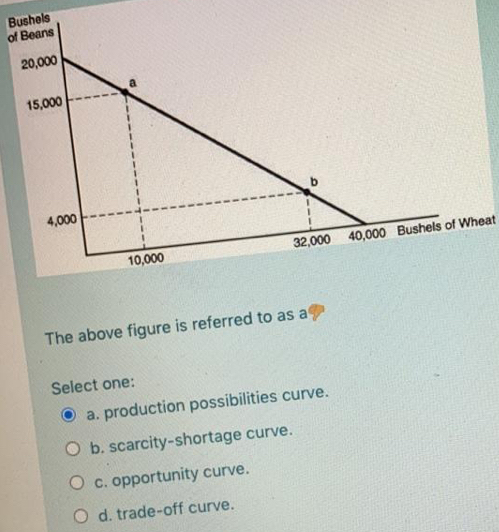
Bushels of Beans 20,000 15,000 4,000 10,000 32,000 40,000 Bushels of Wheat The above figure is referred to as a Select one: a. production possibilities curve. O b. scarcity-shortage curve. O c. opportunity curve. O d. trade-off curve.


Q: Along a bowed-out production possibilities frontier, as more of one good is produced, O a. the…
A: The Production possibility frontier represents the maximum combination of goods and services that…
Q: Which of the following scenarios might explain what an economy would be operating inside its…
A: When the economy is operating under the production possibility curve then this implies that all the…
Q: All of the following basic economic questions deal with microeconomics EXCEPT: O a. How is the…
A: "Since you have asked multiple questions, we will solve the first question for you. If you want any…
Q: QUESTION 7 Ben says that "an increase in the tax on beer will raise its price" Holly arques that…
A: Theories and evidence based statement are called positive statements while statements based on…
Q: Leisure Island has 50 hours of labor a week that it can use to produce entertainment and good food.…
A: Production possibility curve refers to graphically representation of all the different combinations…
Q: Figure 1 Refer to Figure 1. If the economy is currently producing at point Y, what is the…
A: 1. At the points Y and W, the production of paper is the same that is 9. While the production of…
Q: a. Suppose that businesses buy a total of $100 billion of the four resources (labor, land, capital,…
A: Product Market is market where households purchase goods for personal use from firms. Brings…
Q: The figure above shows a nation's production possibilities frontier. In the figure, point A shows O…
A: Production possibility frontier represents the combinations of two goods the economy produces with…
Q: Which of the following statements is true? a. In a world of inefficiently used scarce resources,…
A: Productive efficiency refers to when the producer is operating the production process at maximum…
Q: a. What method is used to ration goods in a market economy?How does this rationing method influence…
A: The forces of supply and demand are used in market economies to set acceptable prices and quantities…
Q: Refer to Figure 3-23. For Bonovia, what is the opportunity cost of a pound of cheese? O a. 0.8…
A: Opportunity cost measures the trade-off that an individual faces in the production of two goods. The…
Q: QUESTION 3 Which of the following will not shift the production possibilities curve to the right? O…
A: The production possibility frontier (PPF) is a curve in business analysis that depicts the…
Q: 1. Assume that the schedule below describes the production possibilities confronting an economy.…
A: (Note: Since there are many questions with multiple parts, only the first three parts of the first…
Q: If the economy is producing at point E, what is the opportunity cost of producing additional 20 ton…
A: At point E, Opportunity cost of additional 20 wheat = amount of steal given up = 90 - 80 = 10 steal
Q: QUESTION 7 Ben says that "an increase in the tax on beer will raise its price" Holly arques that…
A: Tax is the fixed amount of money that the buyer pays to the government for using the product or…
Q: Mohamed says that "gas prices are rising because there aren't enough oil refineries." Ahmed argues…
A: Demand= Desire+willingness+ability.
Q: Figure 2-7 engines 45 40 35 30 25 N 20 15 P 10 10 15 20 25 30 35 40 45 tvs Refer to Figure 2-7. What…
A: In an economy, production resources are not present in infinite numbers which implies that the…
Q: The ability of one producer to produce a good at a lower opportunity cost than another producer is…
A: Opportunity cost means the loss of an alternative when another alternative is selected.
Q: Identify the scarcity definition of economics from the following. a. None of these O b. ways to…
A: The basic problem of economy is the problem of scarcity. There are limited resources and unlimited…
Q: The figure shows the production possibilities frontier for a country. If the economy is operating at…
A: At point B, the country is producing 3 million of gallons milk and 3 million gallons of icecrease.…
Q: For each news item below, indicate whether it involves a what, how, or for whom question. "Fiber…
A: Fiber replaces aluminium in airplanes involves a how question. This question of how involves how…
Q: The shape of the PPF curve illustrates... O A. Decreasing opportunity cost O B. Increasing…
A: The production possibility curve illustrates the combinations of two goods that can be produced with…
Q: Are either or both of these newspaper headlines positive or normative? 1. Smoking causes lung…
A: Positive statements are those which are based on facts and truths. Normative statements are those…
Q: In economics, Economies of Scope occur when: O The production possibilities curve is reduced to one…
A: The term "cost efficient" refers to anything that provides excellent value, with advantages and use…
Q: Which of the following is an example of a normative statement? Select one: a. None of the answers…
A: A normative statement is subjective, judgmental and answers "What should be". A positive statement…
Q: Normative statements are based on O A. the law, which may be quite different in various countries. O…
A: A normative statement conveys a value judgement regarding whether a condition is acceptable or…
Q: e. Continue moving point by point down the PPF. What is the pattern of gains as one chooses to move…
A: e. The gains are constant that is 10 books with varying opportunity costs. The opportunity cost…
Q: I need help with questions 9 and 10. For question 9, since the x and y value are the same, I dont…
A: Production possibility of Alex and Pam:
Q: uppose the economy goes from a point on its production possibilities frontier (PPF) to a po O a. a…
A: PPF shows the different combinations of two goods that can be produced with available resources.
Q: Which of the following questions is NOT a microeconomic question? OA. Why is the unemployment rate…
A: "Since you have asked multiple questions, we will solve first question for you .. If you want any…
Q: The problem of scarcity O A. can be solved in a market economy. O B. exists because the unlimited…
A: Free Market Economy: The free market economy refers to that economy where the law of supply and law…
Q: D. What is the opportunity cost of increasing production from 5,500 tons of cinnamon to 6,500 tons…
A: Since you have asked to solve from D to F so I am answering that only.
Q: Refer to Figure 2-6. If the economy is currently producing at point B, what is the opportunity cost…
A: A production possibility frontier (PPF) shows the maximum possible output combinations of two goods…
Q: a. What is the opportunity cost of producing the first smartphone (point a to b) in terms of the…
A: Opportunity cost: Opportunity cost is defined as the value that would be incurred by accepting that…
Q: Suppose your college instituteş a new policy requiring you to pay for a permit to park your car in a…
A: It is given that college comes with a new policy requiring you to pay for a permit to park your car…
Q: A) Calculate the opportunity cost of : - Increasing production of food from 20 to 30 million units.…
A: Hi! thanks for the question but as per the guidelines we answer up to 3 sub-parts at one time kindly…
Q: Which of the following are examples of positive economics? O A. Tonly. I. A free market in kidneys…
A: Economics is the branch of social science that studies the production, distribution, and consumption…
Q: The amount of capital in an economy is a(n). while the amount of investment is a(n) Select one: O a.…
A: Stock in economics is measured at a specific time and it is a quantity that exist at a specific…
Q: The statement that describes the term Scarcity is O a. a shortage of resources, goods or services O…
A: “Since you have asked multiple questions, we will solve the first question for you. If you want any…
Q: Refer to Table 3-2. What is the opportunity cost of 1 kilogram of meat for the farmer? Select one: O…
A: Farmer Meat produced in 40 hours = 10 kilogram Potatoes produced in 40 hours = 40 kilogram
Q: Actual output equals potential output... A. On the production possibilities curve O B. Within the…
A: Production possibility curve shows the combination of Production of two different goods with the…
Q: Production Production Point chocolate bars cans of cola A 100 10 90 C 20 70 D 30 40 E 40 The above…
A: In economics, opportunity cost can be used to choose one product over another, or it can be used…
Q: Based on the graph, what is the opportunity cost of moving from point B to point D? Baseballs 200…
A: Consider first what is the opportunity cost? Opportunity cost is the loss of a quntity of a good…
Q: Which of the following scenarios might explain what an economy would be operating inside its…
A: The production possibility frontier illustrates the combinations of two goods that can be produced…
Q: 4) The fact that wants cannot be fully satisfied with available resources reflects the definition of…
A: 4) B) Scarcity 5) A) a comparative advantage in the production of grapes. 6) A) land, labor,…
Q: which of the following questions is not a microeconomic question? oa. why is wealth unequally…
A:
Q: n of the following is not correct? A typical production possibilities curve indicates how much O…
A: The production possibility curve shows the different combinations of two goods that can be produced…
Q: In economics, normative statements are about Select one: O a. the way things are. O b. the way…
A: Meaning of Economics: Economics refers to different economic activities in the environment; these…
Q: An owner of a landscaping business received extra income in the previous month. She is considering…
A: The opportunity cost of an activity is the value of next best activity forgone in choosing the given…


Trending now
This is a popular solution!

Step by step
Solved in 2 steps

- Explain why societies cannot make a choice above their production possibilities frontier and should not make a choice below it.Could a nation be producing in a way that is allocatively efficient, but productively inefficient?What are the similarities between a consumers budget constraint and societys production possibilities frontier, not just graphically but analytically?
- 1.a Explain the economic link between scarcity, choice and opportunity cost. 1.b Suppose there are two countries (South Africa and Chile) producing two products(Capital goods and consumer goods) with production possibilities per person inSouth Africa lower than in Chile. Use the PPF to substantiate how the future growthof the two countries will change if South Africa devoted a lot of its resources toproducing capital goods today.While producing on the production possibilities frontier. if additional units of a good could be produced at a constant opportunity cost, the production possibilities frontier would be Select one: O a. boswed outward. O b.a straight line. O c bowed inward. O d. positively sloped.4) The fact that wants cannot be fully satisfied with available resources reflects the definition of A) the what tradeoff. B) scarcity. C) the big tradeoff. D) for whom to produce. 5) Suppose the Gallo sisters, Ernestine and Julia, were not on speaking terms with one another. They each raised grapes and peanuts. Ernestine could increase her output of grapes by one bushel if she reduced her output of peanuts by two bushels and Julia could increase her output of grapes by one bushel if she reduced her output of peanuts by four bushels. According to this information, Ernestine has: A) a comparative advantage in the production of grapes. B) a comparative advantage in the production of both goods. C) a comparative advantage in the production of peanuts. D) an absolute advantage in the production of peanuts 6) Factors of production are grouped into four categories: A) land, labor, capital, entrepreneurship B) land, labor, capital, money C) land, capital, money, entrepreneurship D) labor,…
- 1. Describe and illustrate what a Production Possibility Frontier (PPF) for a two good economy looks like, which if it used all its resources, can produce either 300 units of national security or 140 units of health care, or some combination of the two. 2. Explain what the opportunity cost is and calculate it for this example (assume constant opportunity cost).Below is the production possibilities table for consumer goods (washing machine) andcapital goods (tractor): Type of Production Production Possibilities A B C D E Washing Machine 0 4 8 12 16 Tractor 60 54 42 24 0 a. Show these data graphically.b. If the economy is at point B, what is the cost of one more washing machine?What is the cost of one more tractor?c. Explain how the production possibilities frontier reflects the law ofincreasing opportunity costs.a. What is the opportunity cost of producing the first smartphone (point a to b) in terms of the number of hotdogs sacrificed? The cost of the second smartphone (point b to c)? The cost of the third smartphone (point c to d)? b. Explain why PPF is a straight line and why sometimes it is bow-shaped? c. In what ways is your standard of living different from that of your parents or grandparents when they were your age? Why have these changes occurred?
- 1. Below is the production possibilities table for consumer goods (washing machine) and capital goods (tractor): Type of Production Production Possibilities A B C D E Washing Machine 0 4 8 12 16 Tractor 60 54 42 24 0 a) Show these data graphically. b) If the economy is at point B, what is the cost of one more washing machine? What is the cost of one more tractor? c)Explain how the production possibilities frontier reflects the law of increasing opportunity costs.which one of the following is true about the production possibilities frontier (ppf) o a. the information is perfect o b. large number of buyers and sellers o c. free entry and exit o d. government interference in economic activitiesBelow is the production possibilities table for consumer goods (maize) and capital goods (tractors):Type of productionProduction possibilities A B C D Emaize 30 27 21 12 0Tractors 0 2 4 6 8i. Show these data graphically. ii. If the economy is at point C, what is the cost of one more unit of maize? iii. Suppose improvement occurs in the technology of producing tractors but not in the technology of producing maize. Draw the new production possibilities curve. iv. Now assume that a technological advance occurs in producing maize but not in producing tractors. Draw the new production possibilities curve. v. Now draw a production possibilities curve that reflects technological improvement in the production of both goods.
