Business at Terry's Tie Shop can be viewed as falling into three distinct seasons: (1) Christmas (November-December); (2) Father's Day (late May - mid-June); and (3) all other times. Average weekly sales (in $'s) during each of these three seasons during the past four years has been as follows: Season Year 1 Year 2 Year 3 Year 4 1 1810 1976 2241 2280 2008 2155 2306 2408 911 10545 1105 1120 Assuming that the sales is not experiencing any leaner increasing or decreasing trends. 1. Determine a forecast for the average weekly sales in year 5 for season1. (Round to two decimal places) Note: Please type a number and only a number in the text box. Answer: 23
Business at Terry's Tie Shop can be viewed as falling into three distinct seasons: (1) Christmas (November-December); (2) Father's Day (late May - mid-June); and (3) all other times. Average weekly sales (in $'s) during each of these three seasons during the past four years has been as follows: Season Year 1 Year 2 Year 3 Year 4 1 1810 1976 2241 2280 2008 2155 2306 2408 911 10545 1105 1120 Assuming that the sales is not experiencing any leaner increasing or decreasing trends. 1. Determine a forecast for the average weekly sales in year 5 for season1. (Round to two decimal places) Note: Please type a number and only a number in the text box. Answer: 23

Chapter7: Matrices And Determinants
Section7.2: Operations With Matrices
Problem 12ECP

Related questions
Question
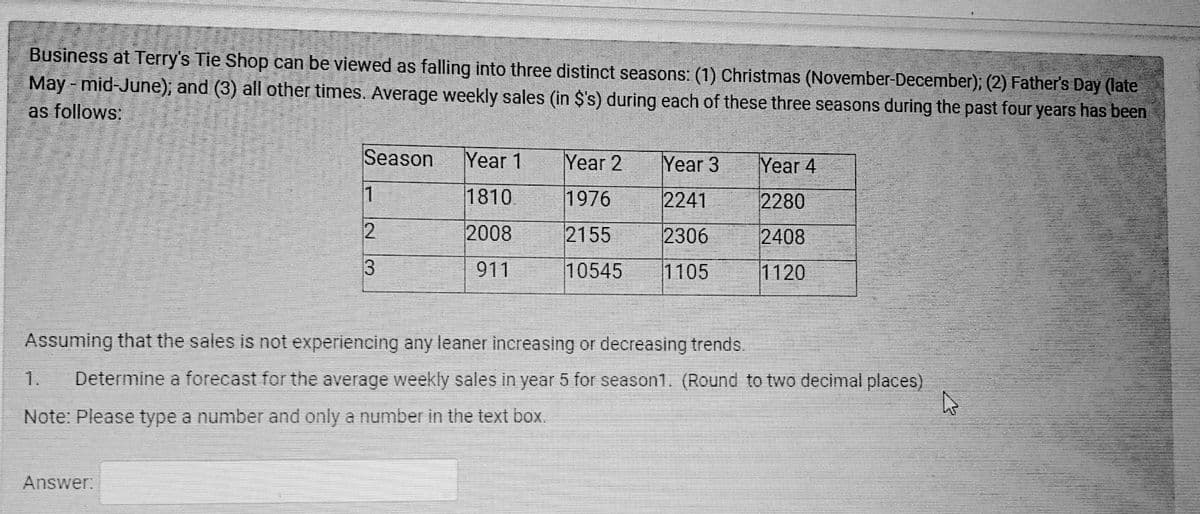
Transcribed Image Text:Business at Terry's Tie Shop can be viewed as falling into three distinct seasons: (1) Christmas (November-December); (2) Father's Day (late
May - mid-June); and (3) all other times.. Average weekly sales (in $'s) during each of these three seasons during the past four years has been
as follows:
Season
Year 1
Year 2
Year 3
Year 4
1
1810
1976
2241
2280
2008
2155
2306
2408
3
911
10545
1105
1120
Assuming that the sales is not experiencing any leaner increasing or decreasing trends.
1.
Determine a forecast for the average weekly sales in year 5 for season1. (Round to two decimal places)
Note: Please type a number and only a number in the text box.
Answer:
Expert Solution
This question has been solved!
Explore an expertly crafted, step-by-step solution for a thorough understanding of key concepts.

This is a popular solution!

Trending now
This is a popular solution!

Step by step
Solved in 2 steps with 1 images

Recommended textbooks for you