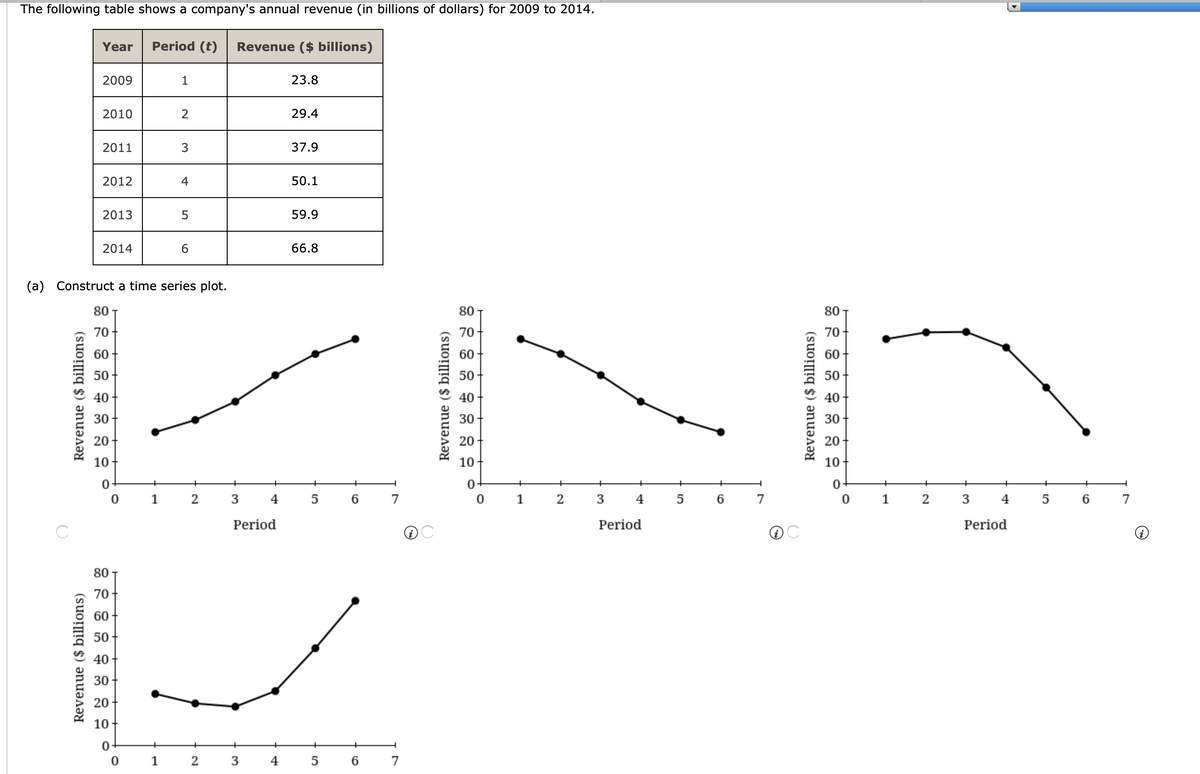
The following table shows a company's annual revenue (in billions of dollars) for 2009 to 2014. Year Period (t) Revenue ($ billions) 2009 1 23.8 2010 29.4 2011 37.9 2012 4 50.1 2013 59.9 2014 6 66.8 (a) Construct a time series plot. 80 80- 80 70- 70- 60 70 60 60 50 50- 50 40- 40 40 · 30 30- 30 20 20 20 10 10 10- 1 2 3 4 5 6 7 1 2 3 4 5 6 7 2 3 4 5 6 7 1 Period Period Period 80 70 60 50 40 30 20 10 Revenue ($ billions) Revenue ($ billions)
The following table shows a company's annual revenue (in billions of dollars) for 2009 to 2014. Year Period (t) Revenue ($ billions) 2009 1 23.8 2010 29.4 2011 37.9 2012 4 50.1 2013 59.9 2014 6 66.8 (a) Construct a time series plot. 80 80- 80 70- 70- 60 70 60 60 50 50- 50 40- 40 40 · 30 30- 30 20 20 20 10 10 10- 1 2 3 4 5 6 7 1 2 3 4 5 6 7 2 3 4 5 6 7 1 Period Period Period 80 70 60 50 40 30 20 10 Revenue ($ billions) Revenue ($ billions)

Algebra & Trigonometry with Analytic Geometry
13th Edition
ISBN:9781133382119
Author:Swokowski
Publisher:Swokowski
Chapter5: Inverse, Exponential, And Logarithmic Functions
Section5.6: Exponential And Logarithmic Equations
Problem 70E

Related questions
Question
Please round answers according to the question
Transcribed Image Text:The following table shows a company's annual revenue (in billions of dollars) for 2009 to 2014.
Year
Period (t)
Revenue ($ billions)
2009
1
23.8
2010
2
29.4
2011
37.9
2012
4
50.1
2013
59.9
2014
6.
66.8
(a) Construct a time series plot.
80
80
80
70
70
70
60
60
60
50
50
50
40
40
40
30
30
30
20
20
20
10
10
10
0-
2
3
4
6.
7
1
2
3
4
5
6
7
1
3
4
5
6
7
Period
Period
Period
OC
80 T
70
60
50
40
30
20
10
0-
1
4
6.
7
Revenue ($ billions)
Revenue ($ billions)
3.
Revenue ($ billions)
Revenue ($ billions)
Transcribed Image Text:60
50
40
30
20
10
1
3
4
5
6.
7
Period
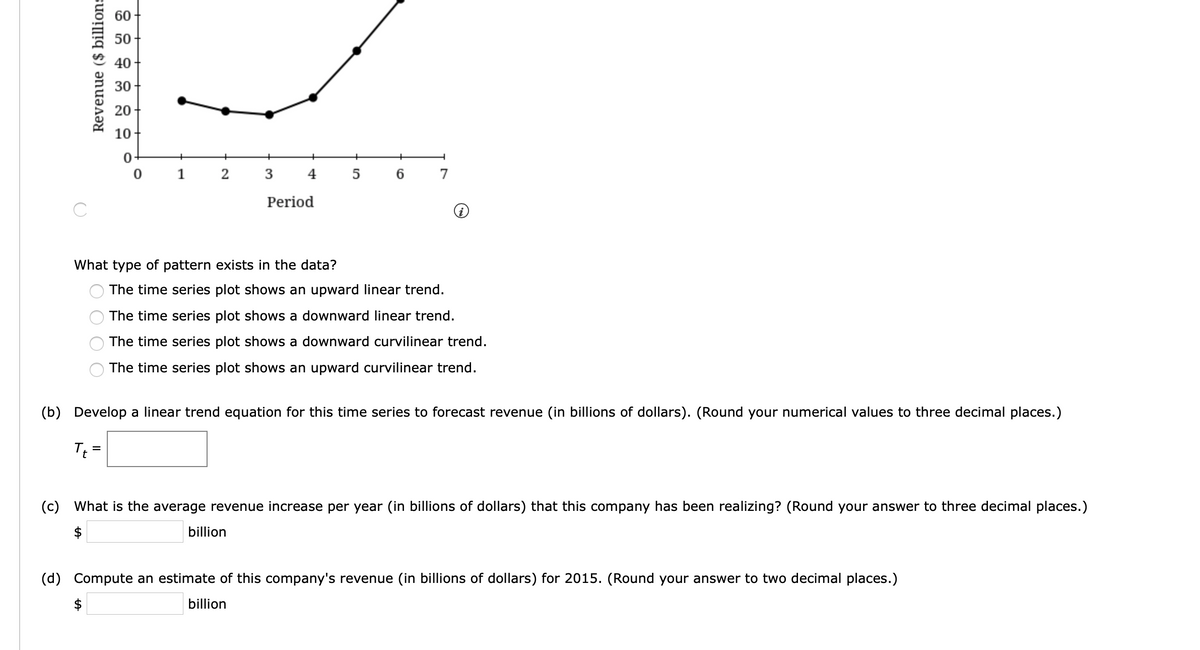
What type of pattern exists in the data?
The time series plot shows an upward linear trend.
The time series plot shows a downward linear trend.
The time series plot shows a downward curvilinear trend.
The time series plot shows an upward curvilinear trend.
(b) Develop a linear trend equation for this time series to forecast revenue (in billions of dollars). (Round your numerical values to three decimal places.)
T =
(c) What is the average revenue increase per year (in billions of dollars) that this company has been realizing? (Round your answer to three decimal places.)
billion
(d) Compute an estimate of this company's revenue (in billions of dollars) for 2015. (Round your answer to two decimal places.)
$
billion
%24
Revenue ($ billions
Expert Solution
This question has been solved!
Explore an expertly crafted, step-by-step solution for a thorough understanding of key concepts.

Step by step
Solved in 3 steps with 3 images

Knowledge Booster


Learn more about
Need a deep-dive on the concept behind this application? Look no further. Learn more about this topic, statistics and related others by exploring similar questions and additional content below.Recommended textbooks for you
Algebra & Trigonometry with Analytic Geometry
Algebra
ISBN:
9781133382119
Author:
Swokowski
Publisher:
Cengage
Algebra & Trigonometry with Analytic Geometry
Algebra
ISBN:
9781133382119
Author:
Swokowski
Publisher:
Cengage