Consider the following time series: Quarter Year 1 Year 2 Year 3 69 66 60 44 36 46 60 62 55 4 79 82 73 (a) Choose a time series plot. (1) 100 80 60 40 20 0 ++ + 1 2 3. 4 6 7 Period (t) 10 11 12 (ii) 100 80 60 40 20 4 5 6 9 10 11 12
Consider the following time series: Quarter Year 1 Year 2 Year 3 69 66 60 44 36 46 60 62 55 4 79 82 73 (a) Choose a time series plot. (1) 100 80 60 40 20 0 ++ + 1 2 3. 4 6 7 Period (t) 10 11 12 (ii) 100 80 60 40 20 4 5 6 9 10 11 12

MATLAB: An Introduction with Applications
6th Edition
ISBN:9781119256830
Author:Amos Gilat
Publisher:Amos Gilat
Chapter1: Starting With Matlab
Section: Chapter Questions
Problem 1P

Related questions
Question
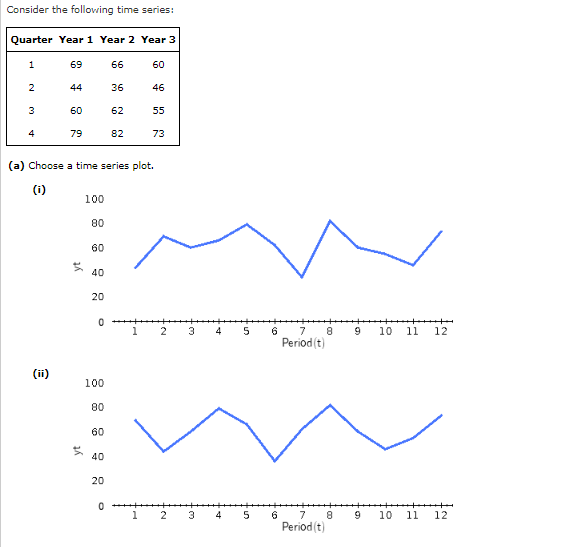
Transcribed Image Text:Consider the following time series:
Quarter Year 1 Year 2 Year 3
1
69
66
60
2
44
36
46
3
60
62
55
4
79
82
73
(a) Choose a time series plot.
(i)
100
80
60
40
20
3.
4
6
7
Period(t)
9
10
11
12
(ii)
100
80
60
40
20
1 2
3.
4
6
7
Period (t)
10
11
12
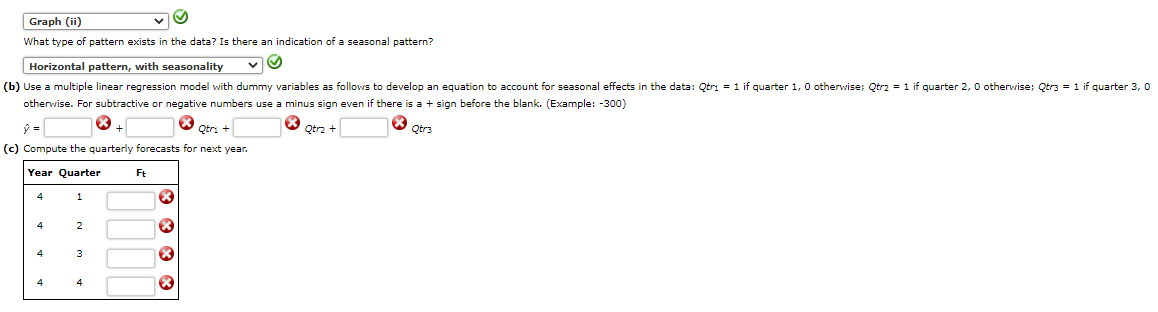
Transcribed Image Text:Graph (ii)
What type of pattern exists in the data? Is there an indication of a seasonal pattern?
Horizontal pattern, with seasonality
(b) Use a multiple linear regression model with dummy variables as follows to develop an equation to account for seasonal effects in the data: Qtri = 1 if quarter 1, 0 otherwise; Qtrz = 1 if quarter 2, 0 otherwise; Qtr3 = 1 if quarter 3, 0
otherwise. For subtractive or negative numbers use a minus sign even if there is a + sign before the blank. (Example: -300)
Qtri
O Otrz +
O Qtr3
(c) Compute the quarterly forecasts for next year.
Year Quarter
Ft
4
1
4
4
3
4
4
Expert Solution
This question has been solved!
Explore an expertly crafted, step-by-step solution for a thorough understanding of key concepts.

This is a popular solution!

Trending now
This is a popular solution!

Step by step
Solved in 2 steps with 2 images

Recommended textbooks for you
MATLAB: An Introduction with Applications
Statistics
ISBN:
9781119256830
Author:
Amos Gilat
Publisher:
John Wiley & Sons Inc

Probability and Statistics for Engineering and th…
Statistics
ISBN:
9781305251809
Author:
Jay L. Devore
Publisher:
Cengage Learning

Statistics for The Behavioral Sciences (MindTap C…
Statistics
ISBN:
9781305504912
Author:
Frederick J Gravetter, Larry B. Wallnau
Publisher:
Cengage Learning
MATLAB: An Introduction with Applications
Statistics
ISBN:
9781119256830
Author:
Amos Gilat
Publisher:
John Wiley & Sons Inc
Probability and Statistics for Engineering and th…
Statistics
ISBN:
9781305251809
Author:
Jay L. Devore
Publisher:
Cengage Learning
Statistics for The Behavioral Sciences (MindTap C…
Statistics
ISBN:
9781305504912
Author:
Frederick J Gravetter, Larry B. Wallnau
Publisher:
Cengage Learning

Elementary Statistics: Picturing the World (7th E…
Statistics
ISBN:
9780134683416
Author:
Ron Larson, Betsy Farber
Publisher:
PEARSON

The Basic Practice of Statistics
Statistics
ISBN:
9781319042578
Author:
David S. Moore, William I. Notz, Michael A. Fligner
Publisher:
W. H. Freeman

Introduction to the Practice of Statistics
Statistics
ISBN:
9781319013387
Author:
David S. Moore, George P. McCabe, Bruce A. Craig
Publisher:
W. H. Freeman