1.The table shows earnings per share of a corporation over a period of 30 years. Year Earnings Year Earnings 1 50.2 16 45.4 2 33.9 17 35.6 20.6 18 30.1 4 25.4 19 25.5 5 32.9 20 22.4 6 31.3 21 12.3 7 18.8 22 20.9 8 14.5 23 42.8 9 17.5 24 86.3 10 23.6 25 73.6 11 20.6 26 47.7 12 21.6 27 56.6 13 27.6 28 53.1 14 36.5 29 48.9 15 49.3 30 41.2 d.Compute R?
1.The table shows earnings per share of a corporation over a period of 30 years. Year Earnings Year Earnings 1 50.2 16 45.4 2 33.9 17 35.6 20.6 18 30.1 4 25.4 19 25.5 5 32.9 20 22.4 6 31.3 21 12.3 7 18.8 22 20.9 8 14.5 23 42.8 9 17.5 24 86.3 10 23.6 25 73.6 11 20.6 26 47.7 12 21.6 27 56.6 13 27.6 28 53.1 14 36.5 29 48.9 15 49.3 30 41.2 d.Compute R?

Chapter12: Sequences, Series And Binomial Theorem
Section12.3: Geometric Sequences And Series
Problem 12.58TI: What is the total effect on the economy of a government tax rebate of $500 to each household in...

Related questions
Question
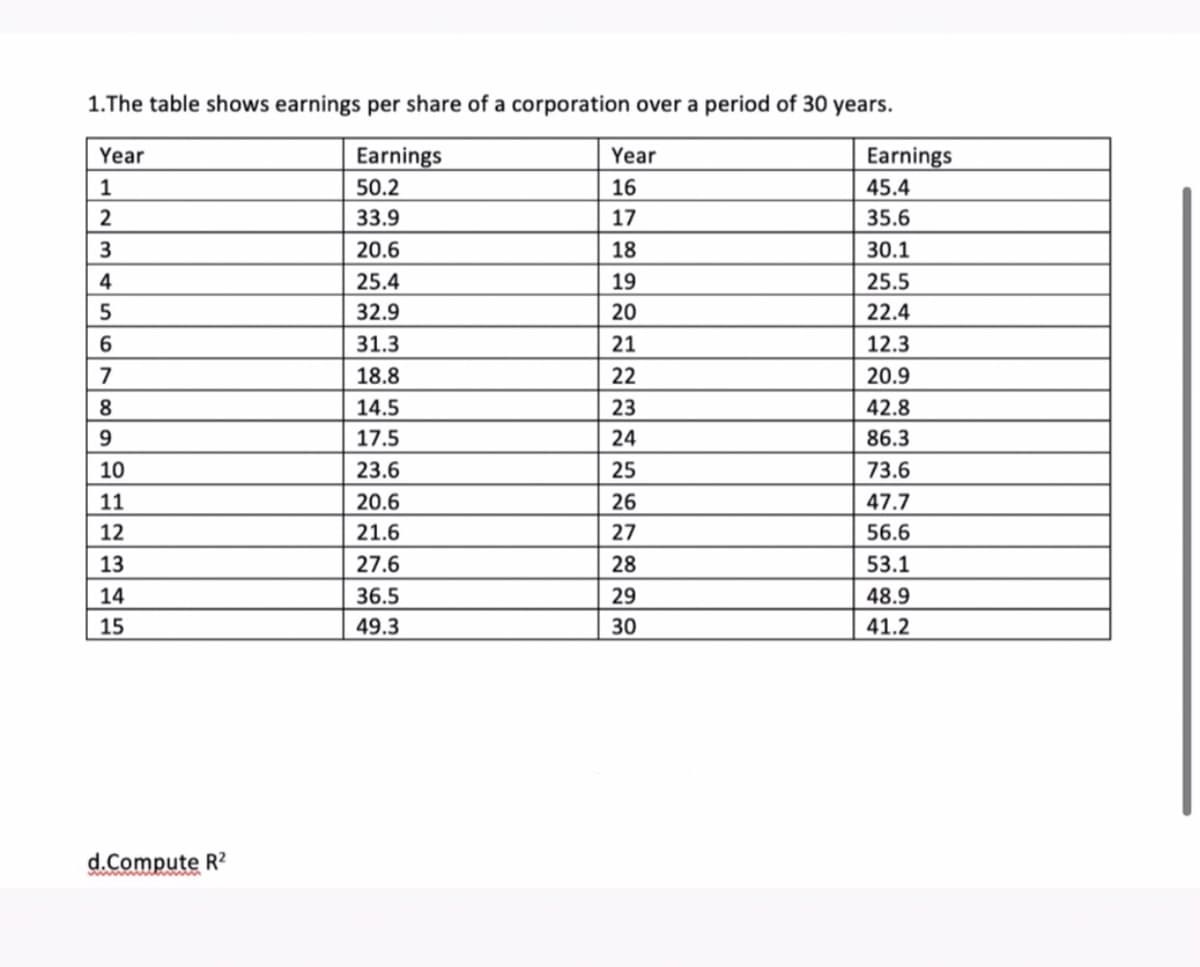
Transcribed Image Text:1.The table shows earnings per share of a corporation over a period of 30 years.
Year
Earnings
Year
Earnings
1
50.2
16
45.4
2
33.9
17
35.6
3
20.6
18
30.1
4
25.4
19
25.5
32.9
20
22.4
31.3
21
12.3
7
18.8
22
20.9
8
14.5
23
42.8
9.
17.5
24
86.3
10
23.6
25
73.6
11
20.6
26
47.7
12
21.6
27
56.6
13
27.6
28
53.1
14
36.5
29
48.9
15
49.3
30
41.2
d.Compute R?
Expert Solution
This question has been solved!
Explore an expertly crafted, step-by-step solution for a thorough understanding of key concepts.

Step by step
Solved in 2 steps with 4 images

Knowledge Booster


Learn more about
Need a deep-dive on the concept behind this application? Look no further. Learn more about this topic, statistics and related others by exploring similar questions and additional content below.Recommended textbooks for you

Algebra & Trigonometry with Analytic Geometry
Algebra
ISBN:
9781133382119
Author:
Swokowski
Publisher:
Cengage
Algebra & Trigonometry with Analytic Geometry
Algebra
ISBN:
9781133382119
Author:
Swokowski
Publisher:
Cengage