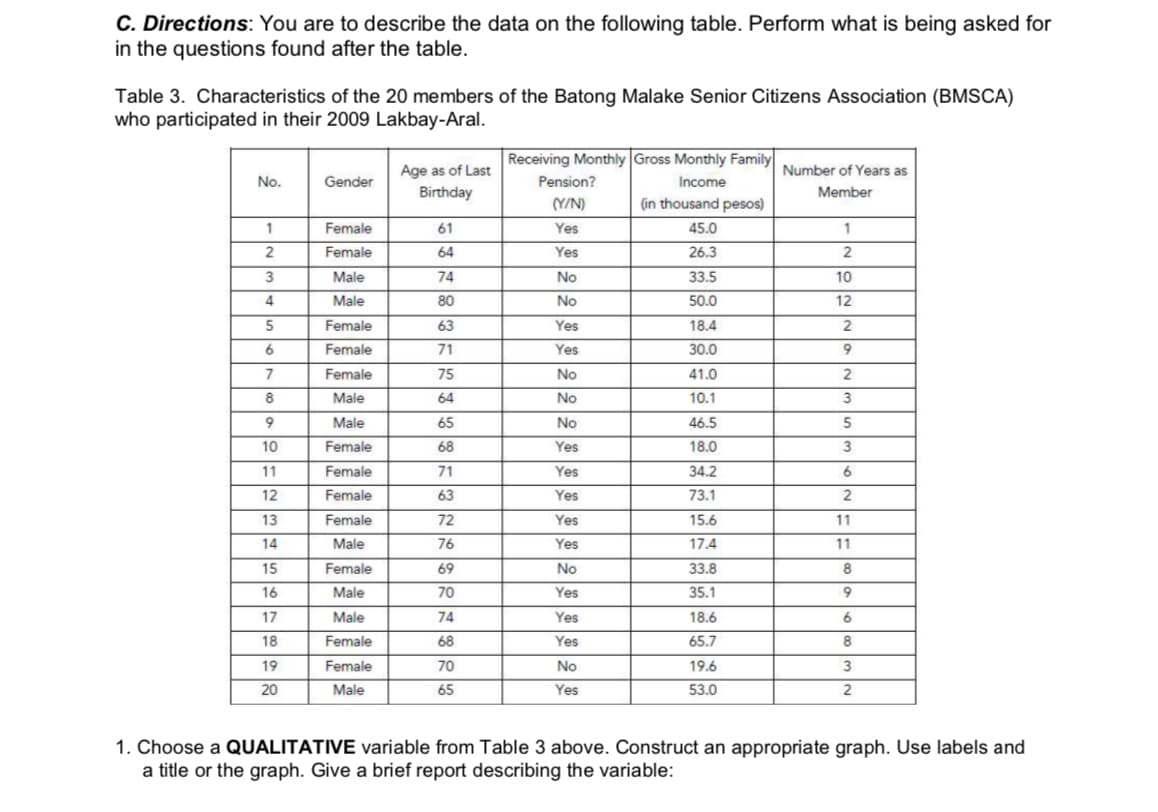
C. Directions: You are to describe the data on the following table. Perform what is being asked for in the questions found after the table. Table 3. Characteristics of the 20 members of the Batong Malake Senior Citizens Association (BMSCA) who participated in their 2009 Lakbay-Aral. Receiving Monthly Gross Monthly Family Age as of Last Birthday Number of Years as No. Gender Pension? Income Member (Y/N) (in thousand pesos) Female 61 Yes 45.0 1 2 Female 64 Yes 26.3 3 Male 74 No 33.5 10 4. Male 80 No 50.0 12 5 Female 63 Yes 18.4 6. Female 71 Yes 30.0 7 Female 75 No 41.0 Male 64 No 10.1 Male 65 No 46.5 10 Female 68 Yes 18.0 Female 71 Yes 34.2 6 12 Female 63 Yes 73.1 13 Female 72 Yes 15.6 11 14 Male 76 Yes 17.4 11 15 Female 69 No 33.8 16 Male 70 Yes 35.1 17 Male 74 Yes 18.6 6. 18 Female 68 Yes 65.7 19 Female 70 No 19.6 20 Male 65 Yes 53.0 2 1. Choose a QUALITATIVE variable from Table 3 above. Construct an appropriate graph. Use labels and a title or the graph. Give a brief report describing the variable:


Correlation
Correlation defines a relationship between two independent variables. It tells the degree to which variables move in relation to each other. When two sets of data are related to each other, there is a correlation between them.
Linear Correlation
A correlation is used to determine the relationships between numerical and categorical variables. In other words, it is an indicator of how things are connected to one another. The correlation analysis is the study of how variables are related.
Regression Analysis
Regression analysis is a statistical method in which it estimates the relationship between a dependent variable and one or more independent variable. In simple terms dependent variable is called as outcome variable and independent variable is called as predictors. Regression analysis is one of the methods to find the trends in data. The independent variable used in Regression analysis is named Predictor variable. It offers data of an associated dependent variable regarding a particular outcome.


Trending now
This is a popular solution!

Step by step
Solved in 3 steps with 2 images


