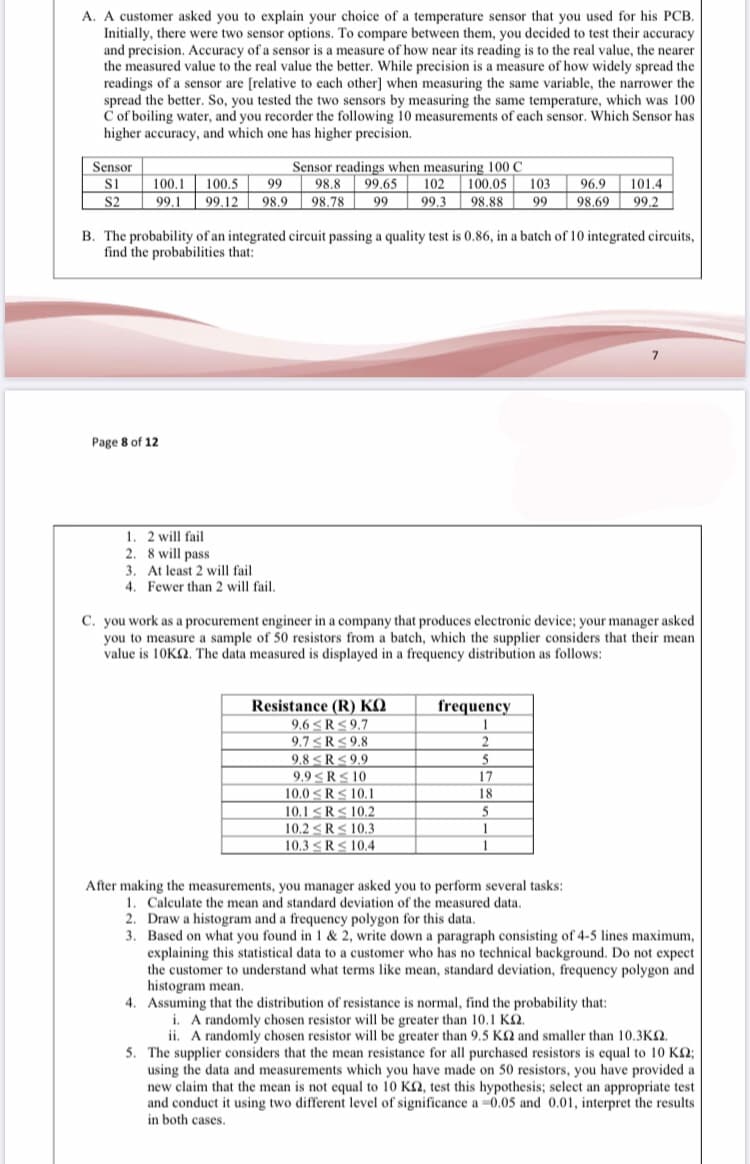
C. you work as a procurement engineer in a company that produces electronic device; your manager asked you to measure a sample of 50 resistors from a batch, which the supplier considers that their mean value is 10K2. The data measured is displayed in a frequency distribution as follows: Resistance (R) KO 9.6


Permutations and Combinations
If there are 5 dishes, they can be relished in any order at a time. In permutation, it should be in a particular order. In combination, the order does not matter. Take 3 letters a, b, and c. The possible ways of pairing any two letters are ab, bc, ac, ba, cb and ca. It is in a particular order. So, this can be called the permutation of a, b, and c. But if the order does not matter then ab is the same as ba. Similarly, bc is the same as cb and ac is the same as ca. Here the list has ab, bc, and ac alone. This can be called the combination of a, b, and c.
Counting Theory
The fundamental counting principle is a rule that is used to count the total number of possible outcomes in a given situation.
hello i need help in part c subparts 4 and 5 please

Step by step
Solved in 2 steps with 4 images


