c. Develop the estimated regression equation that could be used to predict the percentage of games won given the average number of passing yards per attempt. Enter negative value as negative number. d. Provide an interpretation for the slope of the estimated regression equation (to decimal). The slope of the estimated regression line is approximately ________ . So, for every INCREASE of one yard in the average number of passes per attempt, the percentage of games won by the team increases by _____% e. For the 2011 season, the average number of passing yards per attempt for the Kansas City Chiefs was 6.1. Use the estimated regression equation developed in part (c) to predict the percentage of games won by the Kansas City Chiefs. (Note: For the 2011 season the Kansas City Chiefs’ record was 7 wins and 9 losses.)


Inverse Normal Distribution
The method used for finding the corresponding z-critical value in a normal distribution using the known probability is said to be an inverse normal distribution. The inverse normal distribution is a continuous probability distribution with a family of two parameters.
Mean, Median, Mode
It is a descriptive summary of a data set. It can be defined by using some of the measures. The central tendencies do not provide information regarding individual data from the dataset. However, they give a summary of the data set. The central tendency or measure of central tendency is a central or typical value for a probability distribution.
Z-Scores
A z-score is a unit of measurement used in statistics to describe the position of a raw score in terms of its distance from the mean, measured with reference to standard deviation from the mean. Z-scores are useful in statistics because they allow comparison between two scores that belong to different normal distributions.
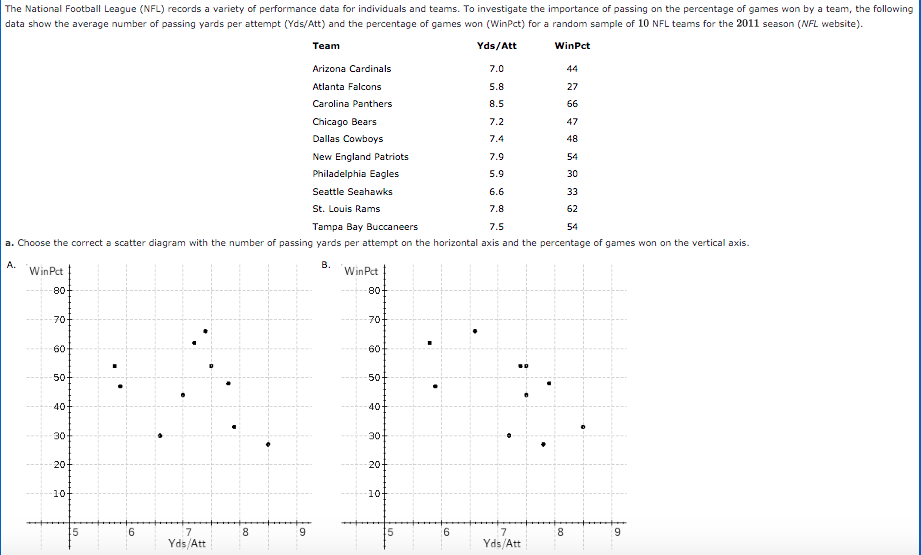
The National Football League (NFL) records a variety of performance data for individuals and teams. To investigate the importance of passing on the percentage of games won by a team, the following data show the average number of passing yards per attempt (Yds/Att) and the percentage of games won (WinPct) for a random sample of 10 NFL teams for the 2011 season (NFL website).
a. Choose the correct a
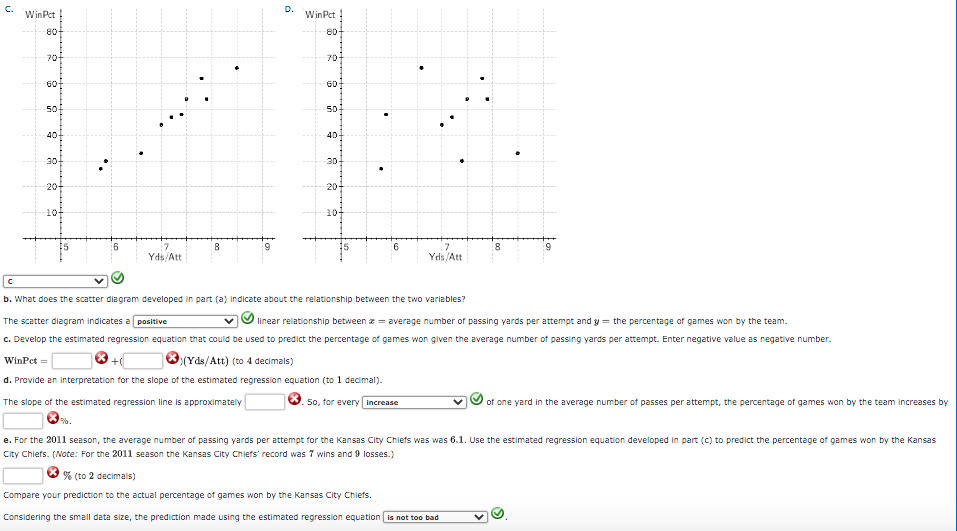
b. What does the scatter diagram developed in part (a) indicate about the relationship between the two variables? The scatter diagram indicates a POSITIVE linear relationship between x= average number of passing yards per attempt and y= the percentage of games won by the team.
(NEED ANSWERS FOR C, D, and E)
c. Develop the estimated regression equation that could be used to predict the percentage of games won given the average number of passing yards per attempt. Enter negative value as negative number.
d. Provide an interpretation for the slope of the estimated regression equation (to decimal). The slope of the estimated regression line is approximately ________ . So, for every INCREASE of one yard in the average number of passes per attempt, the percentage of games won by the team increases by _____%
e. For the 2011 season, the average number of passing yards per attempt for the Kansas City Chiefs was 6.1. Use the estimated regression equation developed in part (c) to predict the percentage of games won by the Kansas City Chiefs. (Note: For the 2011 season the Kansas City Chiefs’ record was 7 wins and 9 losses.)


Trending now
This is a popular solution!

Step by step
Solved in 5 steps with 4 images


