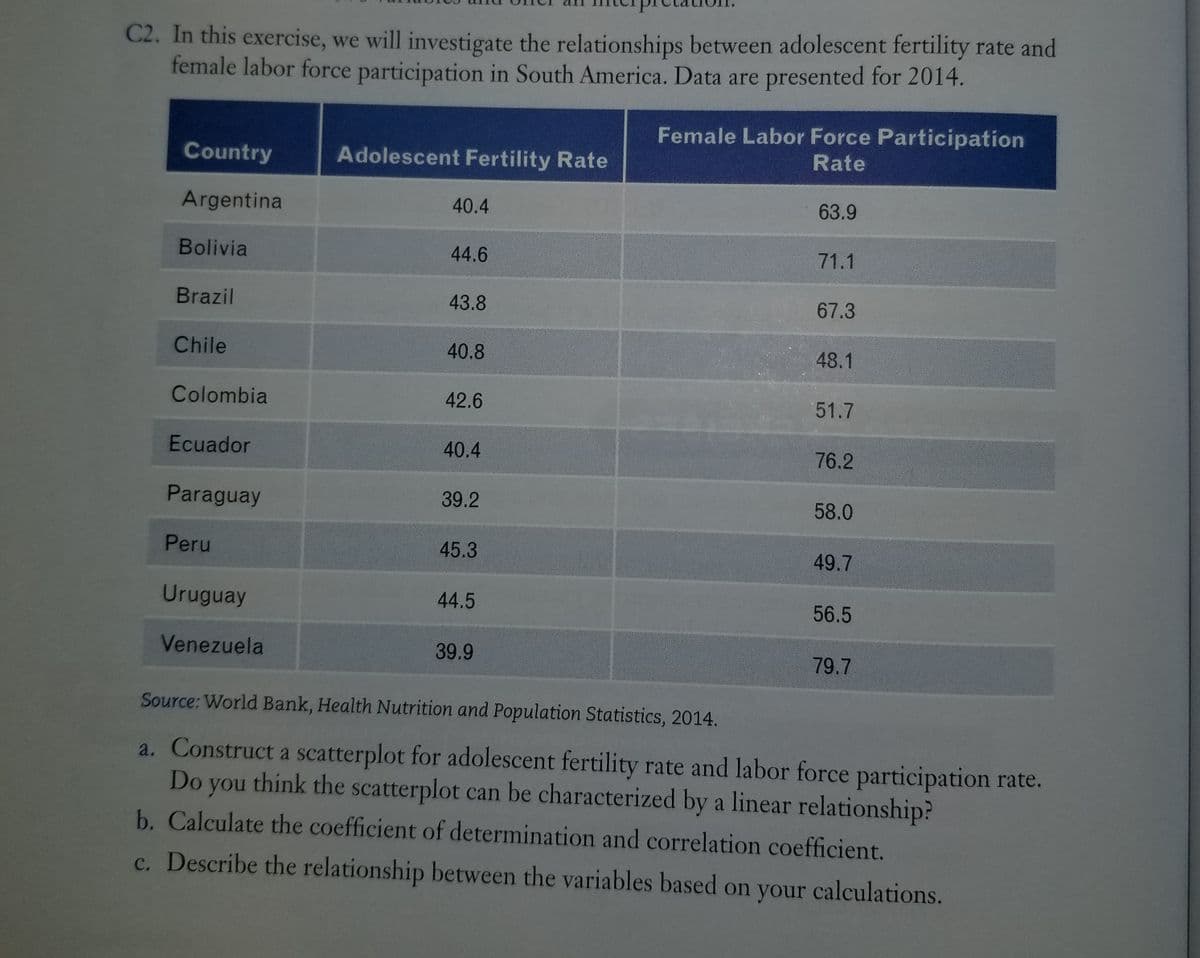
C2. In this exercise, we will investigate the relationships between adolescent fertility rate and female labor force participation in South America. Data are presented for 2014. Female Labor Force Participation Country Adolescent Fertility Rate Rate Argentina 40.4 63.9 Bolivia 44.6 71.1 Brazil 43.8 67.3 Chile 40.8 48.1 Colombia 42.6 51.7 Ecuador 40.4 76.2 Paraguay 39.2 58.0 Peru 45.3 49.7 Uruguay 44.5 56.5 Venezuela 39.9 79.7 Source: World Bank, Health Nutrition and Population Statistics, 2014. a. Construct a scatterplot for adolescent fertility rate and labor force participation rate. Do you think the scatterplot can be characterized by a linear relationship? b. Calculate the coefficient of determination and correlation coefficient. c. Describe the relationship between the variables based on your calculations.
C2. In this exercise, we will investigate the relationships between adolescent fertility rate and female labor force participation in South America. Data are presented for 2014. Female Labor Force Participation Country Adolescent Fertility Rate Rate Argentina 40.4 63.9 Bolivia 44.6 71.1 Brazil 43.8 67.3 Chile 40.8 48.1 Colombia 42.6 51.7 Ecuador 40.4 76.2 Paraguay 39.2 58.0 Peru 45.3 49.7 Uruguay 44.5 56.5 Venezuela 39.9 79.7 Source: World Bank, Health Nutrition and Population Statistics, 2014. a. Construct a scatterplot for adolescent fertility rate and labor force participation rate. Do you think the scatterplot can be characterized by a linear relationship? b. Calculate the coefficient of determination and correlation coefficient. c. Describe the relationship between the variables based on your calculations.

Glencoe Algebra 1, Student Edition, 9780079039897, 0079039898, 2018
18th Edition
ISBN:9780079039897
Author:Carter
Publisher:Carter
Chapter10: Statistics
Section10.6: Summarizing Categorical Data
Problem 25PPS

Related questions
Question
Transcribed Image Text:C2. In this exercise, we will investigate the relationships between adolescent fertility rate and
female labor force participation in South America. Data are presented for 2014.
Female Labor Force Participation
Rate
Country
Adolescent Fertility Rate
Argentina
40.4
63.9
Bolivia
44.6
71.1
Brazil
43.8
67.3
Chile
40.8
48.1
Colombia
42.6
51.7
Ecuador
40.4
76.2
Paraguay
39.2
58.0
Peru
45.3
49.7
Uruguay
44.5
56.5
Venezuela
39.9
79.7
Source: World Bank, Health Nutrition and Population Statistics, 2014.
a. Construct a scatterplot for adolescent fertility rate and labor force participation rate.
Do you think the scatterplot can be characterized by a linear relationship?
b. Calculate the coefficient of determination and correlation coefficient.
c. Describe the relationship between the variables based on your calculations.
Expert Solution
This question has been solved!
Explore an expertly crafted, step-by-step solution for a thorough understanding of key concepts.

This is a popular solution!

Trending now
This is a popular solution!

Step by step
Solved in 2 steps with 2 images

Recommended textbooks for you
Glencoe Algebra 1, Student Edition, 9780079039897…
Algebra
ISBN:
9780079039897
Author:
Carter
Publisher:
McGraw Hill

Big Ideas Math A Bridge To Success Algebra 1: Stu…
Algebra
ISBN:
9781680331141
Author:
HOUGHTON MIFFLIN HARCOURT
Publisher:
Houghton Mifflin Harcourt
Glencoe Algebra 1, Student Edition, 9780079039897…
Algebra
ISBN:
9780079039897
Author:
Carter
Publisher:
McGraw Hill
Big Ideas Math A Bridge To Success Algebra 1: Stu…
Algebra
ISBN:
9781680331141
Author:
HOUGHTON MIFFLIN HARCOURT
Publisher:
Houghton Mifflin Harcourt