You have collected data on sales of leggings in each of the four quarters (Q1, Q2, Q3 and Q4) of 2019 and 2020. The data are given in the table below. Q1 Q2 Q3 Q4 leggings sold (millions) in 2019 | 20 leggings sold (millions) in 2020 20 45 60 22 20 40 65 You are asked to find out whether the data from 2019 can be used as a model for legging sales in 2020. To do so, you are asked to test the hypothesis HO: the 2020 data fits the expected model, at 5% significance. (a) What is the expected value (of leggings sold, in millions) for Q2 of 2020? Give your answer as a decimal written to two decimal places: (b) What is the Pearson Chi-squared test statistic? Give your answer as a decimal written to two decimal places: (C) How many degrees of freedom are there?
You have collected data on sales of leggings in each of the four quarters (Q1, Q2, Q3 and Q4) of 2019 and 2020. The data are given in the table below. Q1 Q2 Q3 Q4 leggings sold (millions) in 2019 | 20 leggings sold (millions) in 2020 20 45 60 22 20 40 65 You are asked to find out whether the data from 2019 can be used as a model for legging sales in 2020. To do so, you are asked to test the hypothesis HO: the 2020 data fits the expected model, at 5% significance. (a) What is the expected value (of leggings sold, in millions) for Q2 of 2020? Give your answer as a decimal written to two decimal places: (b) What is the Pearson Chi-squared test statistic? Give your answer as a decimal written to two decimal places: (C) How many degrees of freedom are there?

Big Ideas Math A Bridge To Success Algebra 1: Student Edition 2015
1st Edition
ISBN:9781680331141
Author:HOUGHTON MIFFLIN HARCOURT
Publisher:HOUGHTON MIFFLIN HARCOURT
Chapter1: Solving Linear Equations
Section1.5: Rewriting Equations And Formula
Problem 49E

Related questions
Topic Video
Question
Please provide an accurate answer for each part with some useful explanation, and please dont copy content from other sources.thanks
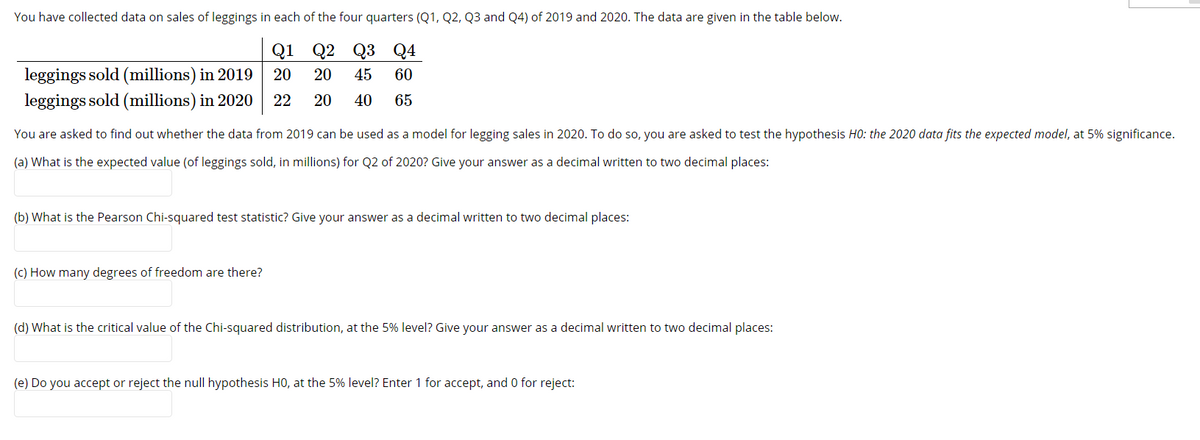
Transcribed Image Text:You have collected data on sales of leggings in each of the four quarters (Q1, Q2, Q3 and Q4) of 2019 and 2020. The data are given in the table below.
Q1 Q2 Q3
Q4
leggings sold (millions) in 2019
leggings sold (millions) in 2020
20
20
45
60
22
20
40
65
You are asked to find out whether the data from 2019 can be used as a model for legging sales in 2020. To do so, you are asked to test the hypothesis HO: the 2020 data fits the expected model, at 5% significance.
(a) What is the expected value (of leggings sold, in millions) for Q2 of 2020? Give your answer as a decimal written to two decimal places:
(b) What is the Pearson Chi-squared test statistic? Give your answer as a decimal written to two decimal places:
(c) How many degrees of freedom are there?
(d) What is the critical value of the Chi-squared distribution, at the 5% level? Give your answer as a decimal written to two decimal places:
(e) Do you accept or reject the null hypothesis H0, at the 5% level? Enter 1 for accept, and 0 for reject:
Expert Solution
This question has been solved!
Explore an expertly crafted, step-by-step solution for a thorough understanding of key concepts.

Step by step
Solved in 3 steps with 3 images

Knowledge Booster


Learn more about
Need a deep-dive on the concept behind this application? Look no further. Learn more about this topic, statistics and related others by exploring similar questions and additional content below.Recommended textbooks for you
Big Ideas Math A Bridge To Success Algebra 1: Stu…
Algebra
ISBN:
9781680331141
Author:
HOUGHTON MIFFLIN HARCOURT
Publisher:
Houghton Mifflin Harcourt
Big Ideas Math A Bridge To Success Algebra 1: Stu…
Algebra
ISBN:
9781680331141
Author:
HOUGHTON MIFFLIN HARCOURT
Publisher:
Houghton Mifflin Harcourt