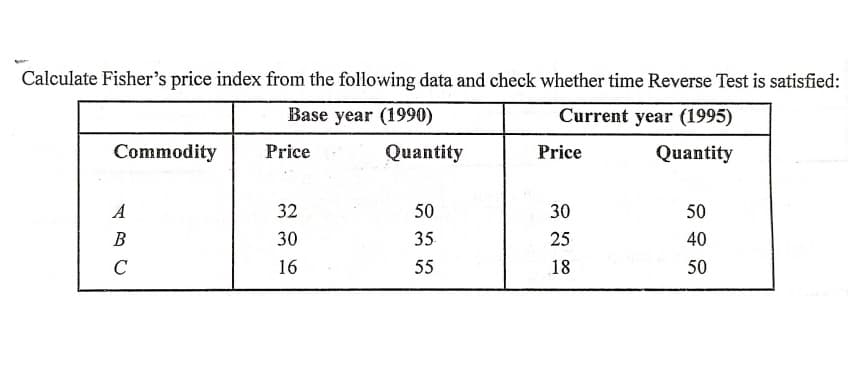
Calculate Fisher's price index from the following data and check whether time Reverse Test is satisfied: Base year (1990) Current year (1995) Commodity Price Quantity Price Quantity A 32 50 30 50 В 30 35 25 40 C 16 55 18 50


Q: if power is 90%, this implies that you have: -a 90% chance of making a type 1 error - a 90% chance o...
A: Type I error: The type I error if the null hypothesis is rejected when it is actually true.
Q: is given by (X – Y) ± Z V where Z. is a real number such that PİZ > 7.) 4 for Z ~ N(0, ).
A:
Q: What is the probability of getting a tail when tossing a coin? A.zero B.1/4 C.1/2 D.3/4
A:
Q: A sample of 108 mortgages approved during the current year showed that 41 were issued to a single-ea...
A:
Q: a large population of adults, the mean IQ is 116 with a standard deviation of 20. Suppose 50 adults ...
A:
Q: Based on a poll, among adults who regret getting tattoos, 22% say that they were too young when they...
A: As per guidelines expert have to answer first question only dear student please upload other subpart...
Q: A player tosses two fair coins. He wins $ 5 if 2 heads occur, $ 2 if 1 head occurs and 1 if no head ...
A: Sample outcomes: {HH,HT,TH,TT} For a fair game is one in which the cost of playing the game is equa...
Q: 1. Let X be a discrete random variable, supported on {0,1,2, 3, 4}. Suppose that the distribution of...
A: Let X be the random variable having values {0, 1, 2, 3, 4} from discrete uniform distribution. ...
Q: A typing school claims that in a six-week intensive course, it can train siudents to type, on the av...
A: Given: Student WPM A 81 B 76 C 53 D 71 E 66 F 59 G 88 H 73 I 80 J 66 K 5...
Q: 2. A researcher transferred two hybrid Red color fishes, from a pure line Red color fish as dominant...
A: Chi-square test : Chi-square test helps to determine the significant difference between the observed...
Q: The amounts of nicotine in a certain brand of cigarette are normally distributed with a mean of 0.92...
A:
Q: 3. If (X(t)} is a WSS process and if Y(t) = h(u) X(t – u)du, then (i) Ryy (T) = R(T)* h(-t) and (ii)...
A:
Q: Check My Work (2 remaining) The manager of a grocery store has taken a random sample of 100 customer...
A:
Q: Here are 6 celebrities with some of the highest net worths (in millions of dollars) in a recent year...
A:
Q: Draw the two ogives for the following distributior showing the number of marks of 59 students : Mark...
A: Given, Marks No. of students 0-10 4 10-20 8 20-30 11 30-40 15 40-50 12 50-60 6 60-...
Q: In Table 2, provide expected proportions for two different MOIS: AD and SLR. The values in this tabl...
A: Please find the solution below. Thank you
Q: Approximate the mean for the following data set. Round your answer to one decimal place. Class Frequ...
A:
Q: bag contains 4 red balls, 3 green balls, and 5 blue balls. The probability of not getting a red ball...
A:
Q: usan bakteria ekstrimofilik Deinococcus radiodurans ditemui direkodkan seper -94.75 -73.42 -94.75 -7...
A: Given information: -94.75 -73.42 56.71 -94.75 -98.01 49.76 -79.86 -69.64 55.18 ...
Q: Consider the following diagram, which includes a concave line of best fit: 40,000 US 35,000 -Belgium...
A: From the graph we see that, GDP per worker for USA is greater than Japan. That we say that USA has h...
Q: Central Limit Theorem for Sums Suppose random samples of n = 37 are collected from an unknown distri...
A:
Q: Scores on ENGDAT exam are normally distributed with a population standard deviation of 5.6. A random...
A:
Q: Question 4 Compute for the area between z = ±1.43.
A:
Q: Let x be a continuous random variable that is normally distributed with a mean of 25 and a standard ...
A: GivenMean(μ)=25standard deviation(σ)=4
Q: Given the list of six numbers: 1, 2, 13, 50, 60, 62. If the number 70 is added to the list as the se...
A: Given data is 1,2,13,50,60,62Arrange the data in ascending order1,2,13,50,60,62Mean = sum of the dat...
Q: Donot copy chegg answer that is wrong otherwise i dislike it ,,? During the first 14 weeks of a p...
A: The hypotheses are given below: Null hypothesis: H0: p=0.5. Alternative hypothesis: Ha:p>0.5. Sin...
Q: This table referes to the rainfall received at Free State, South Africa at their 8 stations in the p...
A: Provided the data from the different 8 stations of the rainfall and area to get average rainfall
Q: The Queen decided to change the distribution of wealth in Arecima. With the help of the royal statis...
A: Given Information: The mean was increased from 100 to 120. The standard deviation was reduced from 2...
Q: Calculate the expected value of x, the sum of the scores, when two dice are rolled.
A:
Q: Hellen has just started a new years competition for her local climbing gym. There are two categories...
A: Given - Mean =μ= 38 hours, Standard Deviation=σ= 6 hours, Sample Size= n = 18 Singles Distribution :...
Q: Calculate Fisher's price index from the following data and check whether time Reverse Test is satisf...
A:
Q: Out of a sample of 10,000 men, the probability that a man picked at random weighs over 190 pounds is...
A: GivenThe probability that a man picked at random weighs over 190 pounds = 0.25The probability that a...
Q: In a recent research poll, 83.4% of 500 randomly selected men in the U. S. knew the name of our curr...
A: There are two independent samples which are men and women. We have to construct 95% confidence inter...
Q: Lesson 10 Q8 The probability distribution of a random variable is given below. Find the value of a...
A: X 0 1 2 P(X) 2a a 3a
Q: 'Example 7-37. A random variable X assumes the value M, 2, ... with probabilities U1, Uz, ... respec...
A:
Q: %24 6. E Module 3 Ch 8 Calculation MindTap - Cengage Learning X MindTap - Cengage Learning X E Home-...
A: As per guidelines expert have to answer first question only dear student please upload other subpart...
Q: A large private university and a large public university selected random sample of incoming freshman...
A:
Q: Two cards are selected at random from a box which contains five cards numbered 1, 1, 2, 2, and 3. Le...
A:
Q: The probability distribution for a discrete random variable is given below: X 4 6 8...
A: Given that Probability distribution table X 4 6 8 10 P(x) 0.40 0.10 0.20 0.30 We know th...
Q: In 2016, the CDC estimated the mean weight of U.S. women over the age of 20 years old was 168.5 poun...
A:
Q: 5.2.35-T Question Help A pharmaceutical company recelves large shipments of aspirin tablets. The acc...
A:
Q: What is P(-2.528 < T < 2.528) when T has a t-distribution with 20 df?
A: Given,df=20P(-2.528<T<2.528)
Q: Find the z value that corresponds to the given area. -0.4066
A: From the provided information, The area to the right side is 0.4066. That is P (Z > z) = 0.4066
Q: Sample A: (2, 4,3, 6, 7,9} Sample B: (3,2,5,7,8, 11} Sample C: (5, 2, 4,8, 10, 11, 12) Sample D: (4,...
A: Given: Sample A Sample B Sample C Sample D 2 3 5 4 4 2 2 5 3 5 4 6 6 7 8 2 7 8 10 8 ...
Q: . Marty Schatz owns and manages a chili dog and soft drink store near the campus. Although Marty can...
A: Given Information: Marty can serve 30 customers per hour on an average. i.e., μ=30 He only gets 20 c...
Q: 1. From the Kaplan-Meier approach of estimating survival probabilities, we can see if two groups are...
A: 1. True 2. False 3. True 4. True
Q: Compare the two models based on the forecast errors. Which is the appropriate model to use? Why? Sea...
A: Given the data as Time (t) Sales Seasonally adjusted linear trend (Ft/s) 1 184 222.25 2 22...
Q: A distribution of values is normal with a mean of 123.2 and a standard deviation of 62 Find P35, whi...
A: Given: A distribution of values is normal with μ=123.2 , σ=62
Q: Yij - y = yij – J,. = yj - , + , -y. Given %3D | (Yj – y)? [(Yj – Y;) + Cỹ, – y) - - i. be
A: Given that yij-y¯..=yij-y¯i.+y¯i.-y¯.......................(1)yij-y¯..2=yij-y¯i.+y¯i.-y¯..2............
Q: 3. How close to actual revenues could you expect a forecast to be 95% of the time? 4. What range in ...
A: 4. Excel Procedure: Enter General Motor revenue and GM revenues in Excel Go to Data Click on Data A...

Step by step
Solved in 2 steps

- Determine: a) chain absolute increase for July: b) base relative increase for August: c) base dynamics index for October: Geometric mean calculated from equals 1.02, which means that:2. Given the data, test whether there is a relationship between the number of years in college (X) of thestudents and their subsequent yearly income at 5% level of significance.Q3The following information was recorded in a toy store: Year 2016 Year 2017 Year 2018 Price Quantity Price Quantity Price Quantity Slime 6 50 9 60 10 56 Sticky tact 2 100 2 105 2 120 Stinky egg 4 60 4 50 6 60 Teddy Bear 10 30 11 26 12 24 Tortoise 8 40 11 39 12 36 Q3The following information was recorded in a toy store: (a) By using the above data, compute the Laspeyres Price Index for year 2018 by using year 2016 as base year. (b) Interpret your answer in part (a)). (c) By using the above data, compute the Paasche Price Index for year 2018 by using year 2016 as base year. (d) Which item has experienced the greatest inflation rate from year 2017 to year 2018? (Just state your answer, no calculation is needed in part (d)).
- Construct index number of price from the following data byapplying: a ) Laspeyre’s method Commodity Price Quantty Price QuanttyA 2 8 4 6B 5 10 6 5C 4 14 5 10D 2 19 2 13Construct index number of price from the following data byapplying: 1)Paasche’s method Commodity Price Quantty Price QuanttyA 2 8 4 6B 5 10 6 5C 4 14 5 10D 2 19 2 13Given the following data for demand at the XYZ Company, calculate the monthly forecast for 2003 using a 3-month moving average. Calculate the Forecast, Error, MAD (mean absolute percentage error), Bias and the TS (tracking signal) .
- Observe the mean, the standard deviation, and the CV of the annual rate of return of the portfolio. Apple Historical Annual Stock Price Data Year Average Stock Price Year Open Year High Year Low Year Close Annual % Change 2021 135.6974 129.4100 156.6900 116.3600 148.7600 12.11% 2020 95.3468 75.0875 136.6900 56.0925 132.6900 80.75% 2019 52.0640 39.4800 73.4125 35.5475 73.4125 86.16% 2018 47.2634 43.0650 58.0175 36.7075 39.4350 -6.79% 2017 37.6378 29.0375 44.1050 29.0050 42.3075 46.11% 2016 26.1510 26.3375 29.5625 22.5850 28.9550 10.03% 2015 30.0096 27.3325 33.2500 25.7800 26.3150 -4.64% 2014 23.0661 19.7546 29.7500 17.8494 27.5950 37.72% 2013 16.8798 19.6082 20.3604 13.9475 20.0364 5.42% 2012 20.5732 14.6868 25.0750 14.6868 19.0062 31.40% 2011 13.0002 11.7704 15.0800 11.2614…The table below shows percentage changes (xi) in the Dow-Jones index over the first five trading days of each of thirteen years and also the corresponding percentage changes (yi) in another index. xi yi 1.5 14.9 0.2 -9.2 -0.1 19.6 2.8 20.3 2.2 -3.7 -1.6 27.7 -1.3 22.6 5.6 2.3 -1.4 11.9 1.4 27.0 1.5 -4.3 -4.7 20.3 1.1 4.2 1- Calculate the sample correlation and interpret. 2- Test at the 1% significance level, against a two-sided alternative, the null hypothesis that the population correlation is 0. Thanks.Consider the following data:Monthly Profit of an Auto Repair Shop Month Jan-14 Feb-14 Mar-14 Apr-14 May-14 Jun-14 Jul-14 Aug-14 Sep-14 Profit ($) 17,93117,931 18,08118,081 16,85516,855 19,04619,046 20,56320,563 17,39017,390 19,12319,123 18,66618,666 20,47020,470 Step 2 of 4: Determine the three-period weighted moving average for the next time period with weights of 33 (most recent), 22 (second latest time period), and 11 (oldest time period). If necessary, round your answer to one decimal place.
- For a period of 11 years, the figures in the accompanying table were found for annual change in unemployment rate and annual change in mean employee absence rate due to own illness. Year Change in UnemploymentRate Change in Mean Employee Absence Rate Due to Own Illness (Y) 1 -0.2 0.2 2 -0.1 0.2 3 1.4 0.2 4 1.0 -0.4 5 -0.3 -0.1 6 -0.7 0.2 7 0.7 -0.1 8 2.9 -0.8 9 -0.8 0.2 10 -0.7 0.2 11 -1.0 0.2 a. Estimate the linear regression of change in mean employee absence rate due to own illness on change in unemployment rate. b. Interpret the estimated slope of the regression line. thanks.Consider the following data:Monthly Profit of an Auto Repair Shop Month Jan-14 Feb-14 Mar-14 Apr-14 May-14 Jun-14 Jul-14 Aug-14 Sep-14 Profit ($) 15,70915,709 15,85915,859 14,65514,655 16,71316,713 18,36318,363 17,17017,170 19,14519,145 18,42418,424 20,20620,206 Step 1 of 4 : Determine the three-period moving average for the next time period. If necessary, round your answer to one decimal place.Listed below is the selling price for a share of PepsiCO Inc. at the close of each year. Year Price Year Price 1990 12.9135 2000 49.5625 1991 16.8250 2001 48.6803 1992 20.6125 2002 42.2211 1993 20.3024 2003 46.6215 1994 18.3160 2004 52.2019 1995 27.7538 2005 59.8534 1996 29.0581 2006 62.0002 1997 36.0155 2007 77.5108 1998 40.6111 2008 54.7719 1999 35.0230 2009 60.8025 1.Estimate the selling price in 2014.…