Calculate the residuals for the flocks identified. The residual for flock 2 is The residual for flock 17 i The residual for flock 35 is You want to test the significance of this regression equation. The null hypothesis can be phrased as: o The regression equation accounts for a significant portion of the variance in the y scores (counts from the photos) o The intercept of the regression equation is greater than zero o The slope of the regression equation is greater than zero o The regression equation does not account for a significant portion of the variance in the y scores (counts from the photos) The Pearson correlation is r= 0.8662, ssx = 327,086.00, and SSY = 339,559.64. Calculate the SSregression, the SSresidual, and the percentage of the variance explained by the regression equation mentioned previously. The SSregression is explained is The SSresiduall is . The percentage of the variance Use the Distributions tool to help you test the null hypothesis.(Note: Do not use the F-table to calculate the critical value as the answer requires an of an exact df to calculate the value.) F Distribution Numerator Degrees of Freedom - 26 Denominator Degrees of Preedom - 26 1.00 2.00 3.00 4.00 5.00 6.00 7.00 8.00 AAN 0.00 To test the null hypothesis, you will first need to find the critical value of F at alpha = 0.01. F is Next, calculate the F-ratio. The F-ratio i these results, you variance in the y scores (counts from the photos). . Therefore, the null hypothesis is conclude that the regression equation accounts for a significant portion of the On the basis of
Calculate the residuals for the flocks identified. The residual for flock 2 is The residual for flock 17 i The residual for flock 35 is You want to test the significance of this regression equation. The null hypothesis can be phrased as: o The regression equation accounts for a significant portion of the variance in the y scores (counts from the photos) o The intercept of the regression equation is greater than zero o The slope of the regression equation is greater than zero o The regression equation does not account for a significant portion of the variance in the y scores (counts from the photos) The Pearson correlation is r= 0.8662, ssx = 327,086.00, and SSY = 339,559.64. Calculate the SSregression, the SSresidual, and the percentage of the variance explained by the regression equation mentioned previously. The SSregression is explained is The SSresiduall is . The percentage of the variance Use the Distributions tool to help you test the null hypothesis.(Note: Do not use the F-table to calculate the critical value as the answer requires an of an exact df to calculate the value.) F Distribution Numerator Degrees of Freedom - 26 Denominator Degrees of Preedom - 26 1.00 2.00 3.00 4.00 5.00 6.00 7.00 8.00 AAN 0.00 To test the null hypothesis, you will first need to find the critical value of F at alpha = 0.01. F is Next, calculate the F-ratio. The F-ratio i these results, you variance in the y scores (counts from the photos). . Therefore, the null hypothesis is conclude that the regression equation accounts for a significant portion of the On the basis of

Algebra & Trigonometry with Analytic Geometry
13th Edition
ISBN:9781133382119
Author:Swokowski
Publisher:Swokowski
Chapter2: Equations And Inequalities
Section2.2: Applied Problems
Problem 22E

Related questions
Topic Video
Question
This is question has multiple parts.
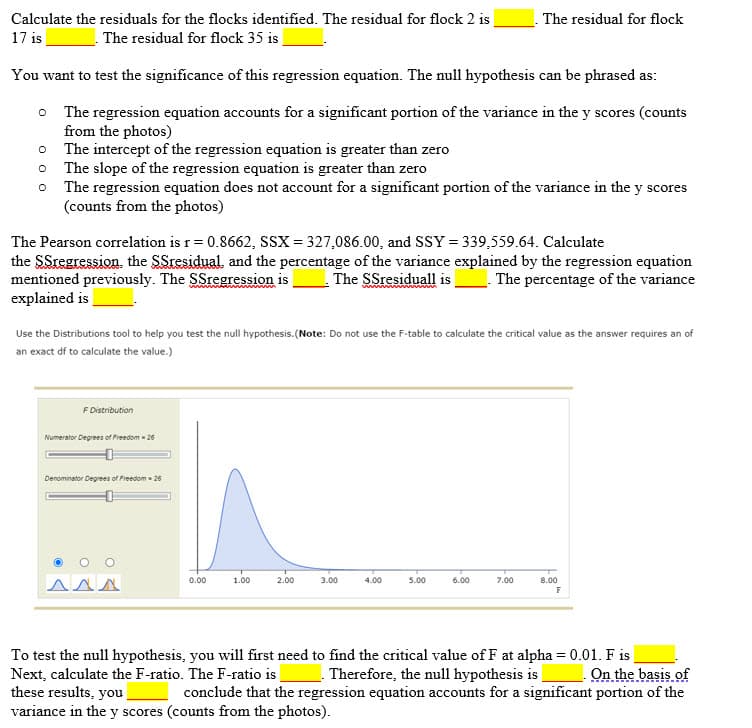
Transcribed Image Text:Calculate the residuals for the flocks identified. The residual for flock 2 is
The residual for flock
17 is
The residual for flock 35 is
You want to test the significance of this regression equation. The null hypothesis can be phrased as:
o The regression equation accounts for a significant portion of the variance in the y scores (counts
from the photos)
The intercept of the regression equation is greater than zero
The slope of the regression equation is greater than zero
o The regression equation does not account for a significant portion of the variance in the y scores
(counts from the photos)
The Pearson correlation is r= 0.8662, SSX = 327,086.00, and SSY = 339,559.64. Calculate
the SSregression. the SSresidual and the percentage of the variance explained by the regression equation
mentioned previously. The SSregression is
explained is
The SSresiduall is__. The percentage of the variance
Use the Distributions tool to help you test the null hypothesis.(Note: Do not use the F-table to calculate the critical value as the answer requires an of
an exact df to calculate the value.)
F Distribution
Numerator Degrees of Freedom - 26
Denominator Degrees of Freedom - 26
0.00
1.00
2.00
3.00
4.00
5.00
6.00
7.00
8.00
AAN
F
To test the null hypothesis, you will first need to find the critical value of F at alpha = 0.01. F is
Next, calculate the F-ratio. The F-ratio i
these results, you
variance in the y scores (counts from the photos).
Therefore, the null hypothesis is
conclude that the regression equation accounts for a significant portion of the
On the basis of
![Experienced observers use aerial survey methods to estimate the number of snow geese in their summer
range area west of Hudson Bay, Canada. A small aircraft flies over the range, and when a flock of geese
is spotted, the observer estimates the number of geese in the flock.
To investigate the reliability of the estimates, an airplane carrying two goose observers flies over 45
flocks. Each observer makes an independent estimate of the number of geese in each flock. A photograph
is taken of each flock and a count made of the number of geese in the photograph. The sample data for the
45 flocks appear in the DataView tool. [Data source: These data were obtained from Lunneborg. C. E.
(1994). Modeling experimental and observational data. Pacific Grove, CA: Duxbury Press.]
Data Set
Geese
Sample
Variables-3
Observations = 45
Count from a Photo and Observers' Estimates of the Size of Flocks of Geese
C. E. Lunneborg, Modeling Experimental and Observational Data, Duxbury Press, 1994
Variables
Observations
Type v
Missing V
Variable v
Form V
Values V
Observations
Photo
Quantitative
Numeric
45
A Estimate
Quantitative
Numeric
45
B Estimate
Quantitative
Numeric
45
Variable
Variable
Variable
Correlation
Correlation
You will work with goose observer A's estimates in this problem to examine how well observer A's
estimates predict counts from the associated photographs for the same flock. The photographs provide a
highly accurate count of geese; optimally, the observer's estimate would predict the photo-based count for
a specific flock.
First, use the regression equation to predict Y values based on observer A's estimates. The regression
equation, in the format Y = bX + a, is:
Ý = 0.88X + 26.65
where X = goose observer A's estimate,
Ý = an estimate of the goose count from the photograph
In this problem, Y is the actual count of geese in the photograph.
Note: The estimated regression equation can also be obtained by going to the Correlation section in the
DataView tool, specifying the proper dependent (Y) and independent (X) variables, and clicking on the
Linear Regression button.
Ý for flock 17 is
You will need to use the Observations list in the DataView tool to identify goose
observer A's estimate for the appropriate flock. Click on the Observations button in the tool and scroll to
Find the predicted Y values for the flocks 2, 17, and 35. Ÿ for flock 2 is
for flock 35 is
the appropriate flock number.](/v2/_next/image?url=https%3A%2F%2Fcontent.bartleby.com%2Fqna-images%2Fquestion%2F1bd98b7b-59c0-49d8-97f6-9caa2b308a2e%2F12bf597b-07eb-4ae0-9317-e83a4b7208e5%2F612ml9x9_processed.jpeg&w=3840&q=75)
Transcribed Image Text:Experienced observers use aerial survey methods to estimate the number of snow geese in their summer
range area west of Hudson Bay, Canada. A small aircraft flies over the range, and when a flock of geese
is spotted, the observer estimates the number of geese in the flock.
To investigate the reliability of the estimates, an airplane carrying two goose observers flies over 45
flocks. Each observer makes an independent estimate of the number of geese in each flock. A photograph
is taken of each flock and a count made of the number of geese in the photograph. The sample data for the
45 flocks appear in the DataView tool. [Data source: These data were obtained from Lunneborg. C. E.
(1994). Modeling experimental and observational data. Pacific Grove, CA: Duxbury Press.]
Data Set
Geese
Sample
Variables-3
Observations = 45
Count from a Photo and Observers' Estimates of the Size of Flocks of Geese
C. E. Lunneborg, Modeling Experimental and Observational Data, Duxbury Press, 1994
Variables
Observations
Type v
Missing V
Variable v
Form V
Values V
Observations
Photo
Quantitative
Numeric
45
A Estimate
Quantitative
Numeric
45
B Estimate
Quantitative
Numeric
45
Variable
Variable
Variable
Correlation
Correlation
You will work with goose observer A's estimates in this problem to examine how well observer A's
estimates predict counts from the associated photographs for the same flock. The photographs provide a
highly accurate count of geese; optimally, the observer's estimate would predict the photo-based count for
a specific flock.
First, use the regression equation to predict Y values based on observer A's estimates. The regression
equation, in the format Y = bX + a, is:
Ý = 0.88X + 26.65
where X = goose observer A's estimate,
Ý = an estimate of the goose count from the photograph
In this problem, Y is the actual count of geese in the photograph.
Note: The estimated regression equation can also be obtained by going to the Correlation section in the
DataView tool, specifying the proper dependent (Y) and independent (X) variables, and clicking on the
Linear Regression button.
Ý for flock 17 is
You will need to use the Observations list in the DataView tool to identify goose
observer A's estimate for the appropriate flock. Click on the Observations button in the tool and scroll to
Find the predicted Y values for the flocks 2, 17, and 35. Ÿ for flock 2 is
for flock 35 is
the appropriate flock number.
Expert Solution
This question has been solved!
Explore an expertly crafted, step-by-step solution for a thorough understanding of key concepts.

This is a popular solution!

Trending now
This is a popular solution!

Step by step
Solved in 2 steps with 8 images

Knowledge Booster


Learn more about
Need a deep-dive on the concept behind this application? Look no further. Learn more about this topic, statistics and related others by exploring similar questions and additional content below.Recommended textbooks for you
Algebra & Trigonometry with Analytic Geometry
Algebra
ISBN:
9781133382119
Author:
Swokowski
Publisher:
Cengage

Algebra: Structure And Method, Book 1
Algebra
ISBN:
9780395977224
Author:
Richard G. Brown, Mary P. Dolciani, Robert H. Sorgenfrey, William L. Cole
Publisher:
McDougal Littell

Elementary Geometry For College Students, 7e
Geometry
ISBN:
9781337614085
Author:
Alexander, Daniel C.; Koeberlein, Geralyn M.
Publisher:
Cengage,
Algebra & Trigonometry with Analytic Geometry
Algebra
ISBN:
9781133382119
Author:
Swokowski
Publisher:
Cengage
Algebra: Structure And Method, Book 1
Algebra
ISBN:
9780395977224
Author:
Richard G. Brown, Mary P. Dolciani, Robert H. Sorgenfrey, William L. Cole
Publisher:
McDougal Littell
Elementary Geometry For College Students, 7e
Geometry
ISBN:
9781337614085
Author:
Alexander, Daniel C.; Koeberlein, Geralyn M.
Publisher:
Cengage,

Holt Mcdougal Larson Pre-algebra: Student Edition…
Algebra
ISBN:
9780547587776
Author:
HOLT MCDOUGAL
Publisher:
HOLT MCDOUGAL

Glencoe Algebra 1, Student Edition, 9780079039897…
Algebra
ISBN:
9780079039897
Author:
Carter
Publisher:
McGraw Hill