6. Assumption MLR.5 (Homoskedasticity) Suppose you are interested in using the following multiple regression model to study the relationship between y and z1, Z2, I3, ..., Zį: y = Bo + Bizı + Bzz + B3Zs+..+z4 +u Though impossible to observe in reality, suppose you are able to gather a scatter plot of the variance of the error term, Var (u|22, z3, ...Zt), against the first explanatory variable z1, holding all other explanatory variables constant. This scatter plot is shown on the following graph: Note: Var (u | 71, 73, -.., zt) is denoted as Var (u]2) on the vertical axis of the graph. x1 True or False: Given the scatter plot, there is evidence to suggest the model suffers from heteroskedasticity. True O False (zn)mA
6. Assumption MLR.5 (Homoskedasticity) Suppose you are interested in using the following multiple regression model to study the relationship between y and z1, Z2, I3, ..., Zį: y = Bo + Bizı + Bzz + B3Zs+..+z4 +u Though impossible to observe in reality, suppose you are able to gather a scatter plot of the variance of the error term, Var (u|22, z3, ...Zt), against the first explanatory variable z1, holding all other explanatory variables constant. This scatter plot is shown on the following graph: Note: Var (u | 71, 73, -.., zt) is denoted as Var (u]2) on the vertical axis of the graph. x1 True or False: Given the scatter plot, there is evidence to suggest the model suffers from heteroskedasticity. True O False (zn)mA

Glencoe Algebra 1, Student Edition, 9780079039897, 0079039898, 2018
18th Edition
ISBN:9780079039897
Author:Carter
Publisher:Carter
Chapter4: Equations Of Linear Functions
Section4.6: Regression And Median-fit Lines
Problem 22PFA

Related questions

Question
please ans:
Transcribed Image Text:6. Assumption MLR.5 (Homoskedasticity)
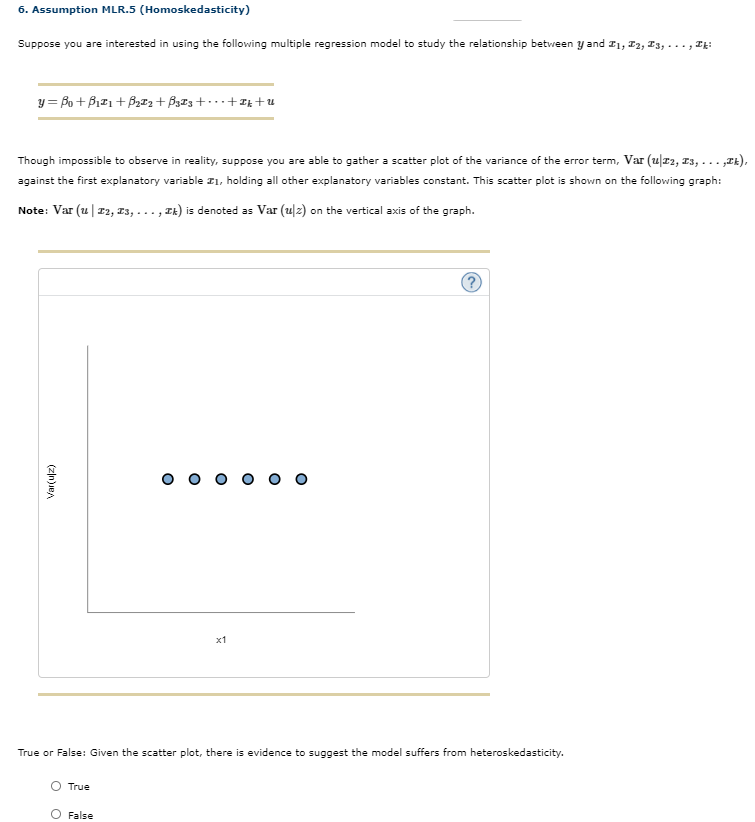
Suppose you are interested in using the following multiple regression model to study the relationship between y and I1, I2, I3, . .. , IĘ:
y = Bo+ B121+ B,I2 + B3¤3 +• · ·+IL +u
Though impossible to observe in reality, suppose you are able to gather a scatter plot of the variance of the error term, Var (u|r2, I3, ... „Zt),
against the first explanatory variable I1, holding all other explanatory variables constant. This scatter plot is shown on the following graph:
Note: Var (u| 12, I3, ..., Ik) is denoted as Var (u/z) on the vertical axis of the graph.
x1
True or False: Given the scatter plot, there is evidence to suggest the model suffers from heteroskedasticity.
True
O False
(zln)ieA
Expert Solution
This question has been solved!
Explore an expertly crafted, step-by-step solution for a thorough understanding of key concepts.

This is a popular solution!

Trending now
This is a popular solution!

Step by step
Solved in 2 steps with 2 images

Knowledge Booster


Learn more about
Need a deep-dive on the concept behind this application? Look no further. Learn more about this topic, statistics and related others by exploring similar questions and additional content below.Recommended textbooks for you
Glencoe Algebra 1, Student Edition, 9780079039897…
Algebra
ISBN:
9780079039897
Author:
Carter
Publisher:
McGraw Hill

College Algebra
Algebra
ISBN:
9781305115545
Author:
James Stewart, Lothar Redlin, Saleem Watson
Publisher:
Cengage Learning

Functions and Change: A Modeling Approach to Coll…
Algebra
ISBN:
9781337111348
Author:
Bruce Crauder, Benny Evans, Alan Noell
Publisher:
Cengage Learning
Glencoe Algebra 1, Student Edition, 9780079039897…
Algebra
ISBN:
9780079039897
Author:
Carter
Publisher:
McGraw Hill
College Algebra
Algebra
ISBN:
9781305115545
Author:
James Stewart, Lothar Redlin, Saleem Watson
Publisher:
Cengage Learning
Functions and Change: A Modeling Approach to Coll…
Algebra
ISBN:
9781337111348
Author:
Bruce Crauder, Benny Evans, Alan Noell
Publisher:
Cengage Learning

Algebra & Trigonometry with Analytic Geometry
Algebra
ISBN:
9781133382119
Author:
Swokowski
Publisher:
Cengage

Linear Algebra: A Modern Introduction
Algebra
ISBN:
9781285463247
Author:
David Poole
Publisher:
Cengage Learning