can you answer D E and F
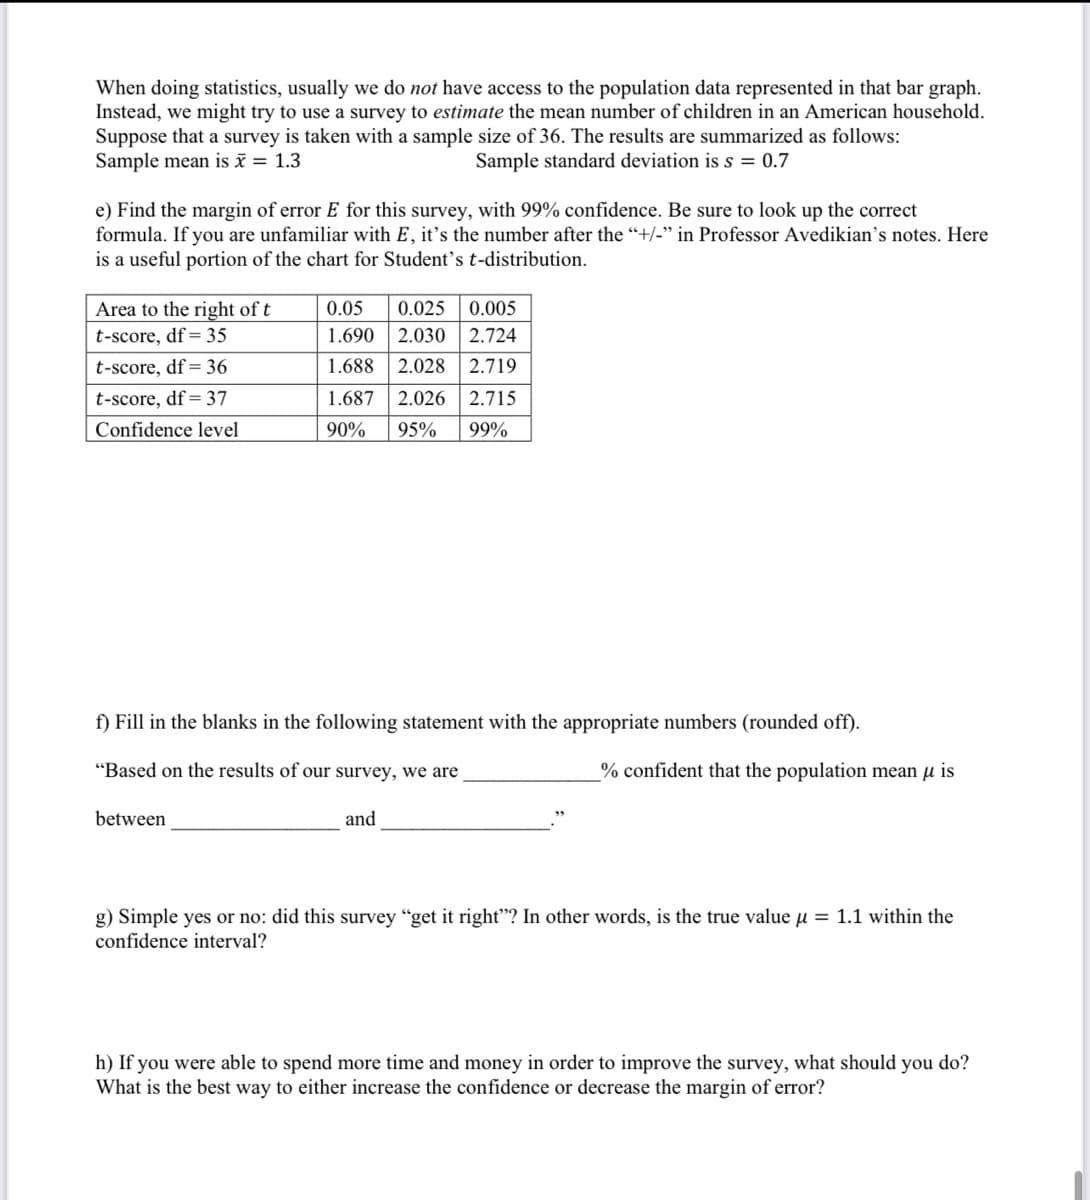
Q: 9. What is Student's t-distribution? A. A distribution that is slightly different from normal, and…
A: T distribution is use for small samples
Q: Suppose we have the following values for actual values (ACTUAL) and forecasted values (FCAST):…
A: Note: As per the guidelines, in case of multiple questions, answer to first question will be…
Q: A mail-order prescription drug vendor measured the number of errors per standard order being picked…
A: Control charts are used to determine whether the lot is acceptable or not. It includes three points,…
Q: Which of the following scatter plots models the data below? 8 10 2 30 40 30 20 10 Scatter plot ia…
A: For the given data Which of the following scatter plots models the data below?
Q: 5. Bayes' theorem for an 'AND’ combined event is: Pr( A 'AND’ B) = Pr( A|B )*Pr( B ). When does this…
A:
Q: On the right are raw test scores from a history test. a. Construct an ordered stem and leaf plot for…
A:
Q: The number of stories in each of a sample of the world’s 20 tallest buildings follows. Construct a…
A: Given data is 55 80 70 79 54 56 78 77 64 60 71…
Q: Approximately, what is the '50-50' center of this distribution? (it is acceptable to give the…
A: In this case, we need to identify the correct option for the given statement.
Q: Assume the random variable X is normally distributed with mean µ = 50 and standard deviation o=7.…
A: Let , the random variable X is normally distributed. Mean = μ= 50 Standard deviation = σ = 7
Q: Manual Transmission Automobiles In a recent year, 6% of cars sold had a manual transmission. A…
A: 0.161<P<0.306
Q: Which of the data is described by the given plot? Scatter Plot 12.2 11.2 10.2 9.2 8.2 7.2 6.2 5.2…
A: Given We need to select appropriate option that data described by the given plot.
Q: (b) Bertie aimed a dart at a dart-board 15 times. The distribution of his scores is: Score, S 2 5 19…
A: Solution: b) Here S be the score and f be the frequency. Calculation table: S f fS 2 3 6 5 4…
Q: A company wants to detemine whether its consumer product ratings (0-10) have changed from last year…
A: List of formulae: Sample mean of differences : d¯ = ∑ d¯in Sample standard deviation of…
Q: Suppose IQ scores were obtained for 20 randomly selected sets of siblings. The 20 pairs of…
A: GivenRegression equation is y=11.54+0.9xr=0.919p-value=0.000
Q: fc 1 11 11 16 32 3 23 69 Total 50 112
A: The given table is c f fc 1 11 11 2 16 32 3 23 69 Total 50 112
Q: Use the following contingency table to complete (a) and (b) below. A B C Total 1…
A: Part 1: A B C 1 20.625 31.875 37.5 2 34.375 53.125 62.5 Part 2: A.H0:πA=πB=πC H1:Not…
Q: Given data is 157, 149, 162, 168, 155, 155, 157.48, 165, 157, 157 sample size (n)=10 sample mean =…
A: Given Sample sizen=10 Sample mean=158.2480 Sample variance=29.6284 Sample standard deviation=5.4432…
Q: A chain letter starts when a person sends a letter to 4 others. Each person who receives the letter…
A: From the specified information, it is interpreted that each person who received the letter sent 4…
Q: The sample means and variances of the observed data are needed to find the values in the sum of…
A: Given Information: No. of treatments=04Total no. of observations=74
Q: 28. Below is a relative frequency bar chart of the number of children in American households. The…
A: Since you have posted a question with multiple subparts, we will solve first three subparts for you.…
Q: In a 2009 study, Tolkamp, Haskell, Langford, Roberts, and Morgan fitted 10 cows with monitors that…
A: The set or collection of all possible observations is defined as the population.
Q: The following are the heights of four students in centimeters. Suppose samples of size 2 are taken…
A: Let all possible random samples of the same size are considered that have been drawn from the same…
Q: 15. Bonus +3 What is its standard deviation? A. 2.3 E. other B. 22 C. 4.4 D. 2.1
A: ( 5 ) Sample Standard deviation S= ?
Q: The amount of money that college students spend on food each week during the academic year is…
A: Given,mean(μ)=31.28standard deviation(σ)=11.42sample size(n)=10
Q: A population of values has a normal distribution with μ=201.4 and σ=41.3 You intend to draw a random…
A: A population of values has a normal distribution with μ=201.4 and σ=41.3 n=77
Q: Which of the following is the correlation coefficient of your data on the number of server users…
A: Obtain the value of the correlation. The value of correlation is obtained below as follows:…
Q: 1) In which scatter diagram is r = -1? a b. 12- 10+ 10+ +8 6+ 4+ 2+ 3 1 2 3 4 d. 12- 12- 10+ 10- 8-…
A: Correlation: Correlation a measure which indicates the “go-togetherness” of two data sets. It can be…
Q: A medical researcher says that less than 72% of adults in a certain country think that healthy…
A:
Q: Find out the correlation that can be observed in the following data: Year 1990 2000 2007 2008 2009…
A: Find out the correlation that can be observed in the following data:
Q: Draw the scatter plot for the following data: X 5 10 15 Y 20 40 60 20 80 25 100
A:
Q: Test the claim that the mean GPA of night students is larger than 3.2 at the 0.025 significance…
A: Consider that μ is the mean GPA of all night students.
Q: What are the findings of the study?
A:
Q: Given the probability Venn diagram below for the two Events A and B find the probabilities: - Pr( A…
A:
Q: Z-Distribution Intervals Collette is self-employed, selling items at Home Interior parties. She…
A: Given that
Q: An artičle in the ACT Materials Journal (Vol. 84, 1987, pp. 213-216) describes several experiments…
A:
Q: Fill in the expected frequencies.
A: here use given data table Outcome Observed Frequency Math/Science 318 Arts &…
Q: L8Q9.Find the relationship between the two variables using the given data. x 1 2 3 4 5 y 15 30 45…
A: Let X denote the independent variable Let Y denote the dependent variable The given data is,
Q: What kind of metrics are the Akaike (AIC), Schwartz (BIC) and Hannan-Quinn statistics? What does the…
A:
Q: Meals are often served at a conference. At one conference: 50% went to breakfast 73% went to dinner…
A: According to the given information, we have P(breakfast) = 50%=0.50P(dinner) = 73% = 0.73P(breakfast…
Q: In an introductory stats course x= midterm score and y final exam score. The midterm score had a…
A: Given information: x=midterm score y=final exam score X¯=75sx=4Y¯=83sy=9 r=0.45 Slope: slope=rsysx…
Q: If money is invested at an interest rate of 7.6 percent per year, find the annual percent yield…
A:
Q: An experiment was conducted to investigate the effects of the concentrations of sulfuric acid…
A:
Q: What is the expected cell count for students who find SAS difficult to learn and who are not…
A: The total number of students who find SAS difficult is 28.
Q: The HR department is trying to fill a vacant position for a job with a small talent pool. Valid…
A:
Q: 25. In a tennis tournament with 18 players, how many possible matchups (one-on-one) are there?
A:
Q: Suppose X, Y and Z are independent random variables with var (X) = 4 , var (Y) = 4 , var (Z) = 1/n…
A: Solution
Q: Problem 4: Use R to solve this problem. Give your code with your solutions. 1- Find the 98th…
A: R programming use to write the command
Q: An article in Wood Science and Technology, "Creep in Chipboard, Part 3: Initial Assessment of the…
A: Given that Using excel regression
Q: Find the slope from the line of best fit y = 7-¾x₁ 31 - 0 -3 O MN
A:
Q: A researcher wants to know whether the amount of stress is different for employees who work the…
A: Given a researcher wants to know if the amount of stress is different for employees who work the…
Step by step
Solved in 4 steps
- A pediatrician wants to determine the relation that may exist between a child's height and head circumference. She randomly selects 8 children from her practice, measures their height and head circumference and obtains the data shown below. Height Head Circumference 27 17.5 25 17 26.5 17.2 25.5 17 27.75 17.4 26.25 17.4 26 17.1 27.25 17.4 data table 3 0.997 4 0.950 5 0.878 6 0.811 7 0.754 8 0.707 9 0.666 10 0.632 11 0.602 12 0.576 13 0.553 14 0.532 15 0.514 16 0.497 17 0.482 18 0.468 19 0.456 20 0.444 21 0.433 22 0.423 23 0.413 24 0.404 25 0.396 26 0.388 27 0.381 28 0.374…A pediatrician wants to determine the relation that may exist between a child's height and head circumference. She randomly selects 8 children from her practice, measures their height and head circumference and obtains the data shown below. Height Head Circumference 27 17.5 25 17 26.5 17.2 25.5 17 27.75 17.4 26.25 17.4 26 17.1 27.25 17.4 data table n 3 0.997 4 0.950 5 0.878 6 0.811 7 0.754 8 0.707 9 0.666 10 0.632 11 0.602 12 0.576 13 0.553 14 0.532 15 0.514 16 0.497 17 0.482 18 0.468 19 0.456 20 0.444 21 0.433 22 0.423 23 0.413 24 0.404 25 0.396 26 0.388 27 0.381 28 0.374 29 0.367 30 0.361 compute the linear correlation coefficient between the height and head circumference of a child. r = ____ (round to three decimal places as…A pediatrician wants to determine the relation that may exist between a child's height and head circumference. She randomly selects 8 children from her practice, measures their height and head circumference and obtains the data shown below. Height Head Circumference 27 17.5 25 17 26.5 17.2 25.5 17 27.75 17.4 26 17.1 27.25 17.4 n 3 0.997 4 0.950 5 0.878 6 0.811 7 0.754 8 0.707 9 0.666 10 0.632 11 0.602 12 0.576 13 0.553 14 0.532 15 0.514 16 0.497 17 0.482 18 0.468 19 0.456 20 0.444 21 0.433 22 0.423 23 0.413 24 0.404 25 0.396 26 0.388 27 0.381 28 0.374 29 0.367 30 0.361 e) Convert the data to centimeters (1 inch = 2.54 cm) and recompute the linear correlation coefficient. What i effect did the…
- 2) A researcher is interested in studying if male smokers and female smokers smoke a different number of cigarettes each day. She takes a sample of 10 male smokers and 10 female smokers from a nearby motorcycle club by asking the first 10 smokers of each gender she encountered. Their results are recorded below. Male 18 25 30 16 24 32 15 27 19 15 Female 12 15 36 30 12 18 34 22 10 12 Answer the following: a. Create appropriate graph(s) that can be used to compare the samples. Using the graph(s) to explain: does it appear that the number of cigarettes smoked by each gender are different? b. To run a formal test, which test will you run and which distribution will you use? Explain why for each. Are there any concerns you have about using the results of this test? c. Write the following hypothesis in symbols: Null Hypothesis: The average number of cigarettes smoked by male and female smokers is the same. H0: ________________________…C) Yes, there appears to be a high outlier in the Meters On data D) No, there does not appear to be any outliersAlice has accumulated $260,557 in savings and wishes to invest this money sensibly. The types of investments and their corresponding percentages, recommended by a financial advisor, are shown in the following circle graph. Recommended Categories of Investment: stocks 13.73% mutual funds 51% real estate 10% annuities10% bonds 15.27% Find the amount of money that Alice should invest in stocks, mutual funds, real estate, annuities, and bonds. Round your answer to the nearest hundredth, if necessary.