can you help label peaks 100 2156 91am-1, 100 53%T 95 08.79om-1. 07 60NT 3011.71om-1, T 960 80cm-1,94.94%T 90 a1,90 72T 14.sam-1, 0ST 85 Wo om-1, noNT 80 12th osom ceT LA Joom-1, 82 87%T .08%T 200 05cm-1, 7 %T 720 secm-1, 80.09%T 75 1008.001, 77.85%T 1404 Soom 1, 74.12%T 70 1045.02om-1, 70.55%T anona hic 65 28 73am-1,03.53%T 60 55 2920.om-1, 52.52%T 514 4000 3500 3000 2500 2000 1500 1000 450 cm-1


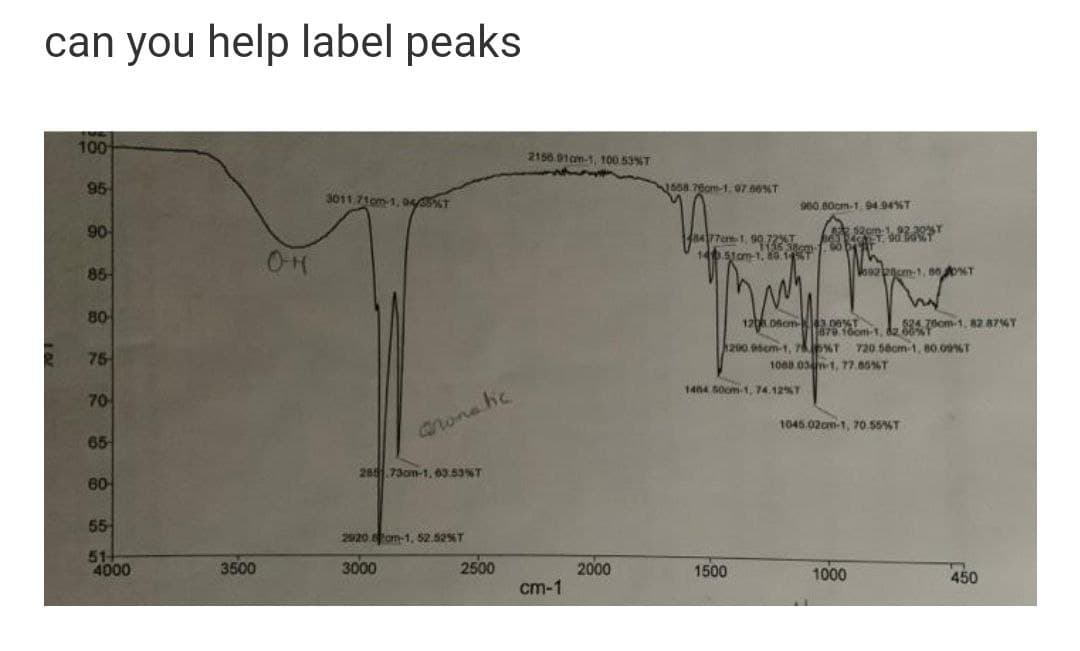
Analyzing Infrared Spectra
The electromagnetic radiation or frequency is classified into radio-waves, micro-waves, infrared, visible, ultraviolet, X-rays and gamma rays. The infrared spectra emission refers to the portion between the visible and the microwave areas of electromagnetic spectrum. This spectral area is usually divided into three parts, near infrared (14,290 – 4000 cm-1), mid infrared (4000 – 400 cm-1), and far infrared (700 – 200 cm-1), respectively. The number set is the number of the wave (cm-1).
IR Spectrum Of Cyclohexanone
It is the analysis of the structure of cyclohexaone using IR data interpretation.
IR Spectrum Of Anisole
Interpretation of anisole using IR spectrum obtained from IR analysis.
IR Spectroscopy
Infrared (IR) or vibrational spectroscopy is a method used for analyzing the particle's vibratory transformations. This is one of the very popular spectroscopic approaches employed by inorganic as well as organic laboratories because it is helpful in evaluating and distinguishing the frameworks of the molecules. The infra-red spectroscopy process or procedure is carried out using a tool called an infrared spectrometer to obtain an infrared spectral (or spectrophotometer).

Step by step
Solved in 2 steps with 1 images


