What is Analyzing Infrared Spectra?
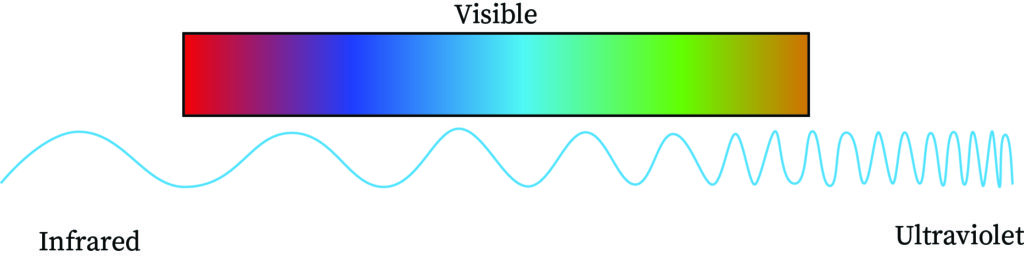
The electromagnetic radiation or frequency is classified into radio-waves, micro-waves, infrared, visible, ultraviolet, X-rays and gamma rays. The infrared spectra emission refers to the portion between the visible and the microwave areas of electromagnetic spectrum. This spectral area is usually divided into three parts, near infrared (14,290 – 4000 cm-1), mid infrared (4000 – 400 cm-1), and far infrared (700 – 200 cm-1), respectively. The number set is the number of the wave (cm-1).
Mid infrared (4000 – 400 cm-1) provides valuable knowledge on the molecular structure and functional groups found in m and is an area of considerable importance and practical application for the organic chemist. The dynamic diagram of the spectrum is given by a simple molecule interacting with radiation. By detailed examination of the maximum to peak association, an organic scientist can use this knowledge to clarify the architecture of the molecule. For quantitative analysis, the absorption intensity or maximum elevation could be examined.
Intensity of Peaks
Bands with varying intensities arise due to the varying rhythms of the differential feature classes of the molecule. That is, since for each of the sounds, it's unique. For example, 2863 cm-1 is the strongest absorbance in the octane spectrum and is due to the C-H bond extension. One of the weakest categories in the octane range is 726 cm-1 and due to its long-chain methyl rock in octane. For the C-H stretching, the adjustment in the dipole moment is bigger than for the C-C-rock motion, and that is reason the C-H stretching band is sharp than the C-C-Rock vibrations. The accumulation of particles is also a factor which specifies the peak intensity in infra - red spectrums. Beer's law is the equation given below which refers to absorbance intensity.
Width of the Peaks
Generally, a variety of chemical conditions relevant to the strengths of intermolecular reactions, such as hydrogen bonding determines the diameter of infrared bands for solid- and liquid samples. As hydrogen bonds vary in number and intensity from the chemical environment, their force consistency varies and the amount of wave varies to capture the infrared light.
Frequencies of Different Group
One significant discovery made by early researchers is that, irrespective of the composition of the other molecule, all functional groups absorb infrared radiation by the same wave numbers. For eg, C-H stretches between 3200 and 2800 cm-1 usually exist, while carbonyl (C=O) stretches between 1800 and 1600cm-1 typically occur. These diagnostic markers for functional group inclusion in a sample are thus made in these bands. This types of infra - red bands are referred to as group frequencies because they inform us that specific functional groups are present or not in a study.
Interpretation of Different Groups
One of the most important applications found of IR spectroscopy is to identify organic compounds. The major classes of organic molecules are shown in this category and also linked on the bottom page for the number of collections of spectral information regarding organic molecules.
Hydrocarbon compounds
It contains only and bonds, but there is plenty of information to be obtained from the IR spectrum arising from stretching and bending.In alkanes, each band in the spectrum is assigned as follows:
- C-H stretch from 3000–2850 cm-1
- C-H bend or scissoring from 1470-1450 cm-1
- C-H rock, methyl from 1370-1350 cm-1
- C-H rock, methyl, seen only in long chain alkanes, from 725-720 cm-1
Functional groups containing the bond
Alcohols have IR absorptions associated with both the and the stretching vibrations.
- O-H stretch, hydrogen bonded 3500-3200 cm-1
- C-O stretch 1260-1050 cm-1 (s)
Organic compounds containing halogens
Alkyl halides are compounds that have a C–X bond, where X can be any halogen like, bromine, chlorine, fluorine or iodine.
- C-H wag (-CH2X ) from 1300-1150 cm-1
- C-X stretches (general) from 850-515 cm-1
- C-Cl stretch 850-550 cm-1
- C-Br stretch 690-515 cm-1
Generally, the infrared spectroscopy bands for inorganic molecules are broader, fewer in number and appear at lower wavenumbers than those observed for organic materials. If an inorganic compound forms covalent bonds within an ion, it can produce a characteristic IR spectrum.
Main infrared spectroscopy bands of some common inorganic ions:
- Carbonate- 1450-1410, 880-800cm-1
- Sulphate- 1130-1080, 680-610cm-1
- Nitrate- 1410-1340, 860-800cm-1
- Phosphate- 1100-950cm-1
Diatomic molecules are found to produce one vibration along the chemical bond. Monatomic ligand, in which the metal coordinates with other atoms such as halogens,can produce characteristic bands.
Absorption spectra of amines
Primary amines contain the -NH2 group, and so have N-H bonds. These amines absorb somewhere between 3100 and 3500 cm-1. That double trough (typical of primary amines) can be seen clearly on the spectrum to the left of the C-H absorptions.

Rules for Identification
There are a few general rules that can be used when using a mid IR spectrum for the determination of a molecular structure. The following is a suggested strategy for spectrum interpretation:
- Look first at the high-wavenumber end of the spectrum (>1500cm-1) and concentration has to be initially on the major bands.
- For each band, 'short-list' all the occurring possibilities by using a correlation table.
- Use the lower-wavenumber end of the spectrum to confirm or elaborate the possible structural elements.
- Do not expect to be able to assign every band in the spectrum.
- Band intensities have to be treated with some caution. Under certain circumstances, they may differ considerably for the same group.
- Take care when using small wavenumber changes. If in solution, some bands are very 'solvent-sensitive'.
- Do not forget to subtract solvent bands whenever possible.
Common Mistakes
The common mistake while interpreting an IR spectrum will usually occur while estimating the functional group present. Care should be taken to read the bands properly or else wrong functional groups will be reported.
Context and Applications
This topic is significant in the professional exams for both undergraduate and graduate courses, especially for Bachelors and Masters in Chemistry.
Want more help with your chemistry homework?
*Response times may vary by subject and question complexity. Median response time is 34 minutes for paid subscribers and may be longer for promotional offers.
Analyzing Infrared Spectra Homework Questions from Fellow Students
Browse our recently answered Analyzing Infrared Spectra homework questions.