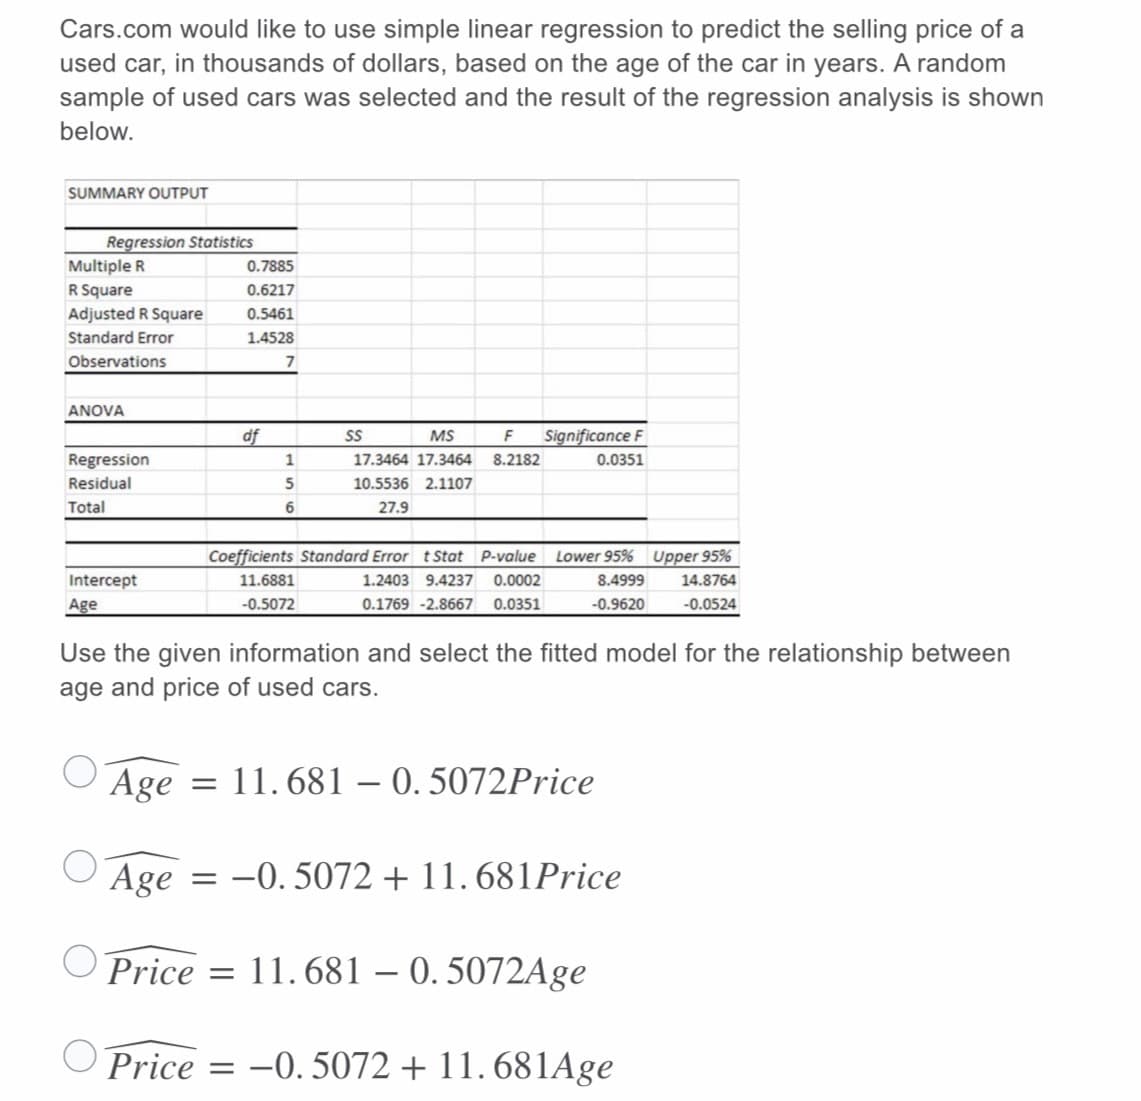
Cars.com would like to use simple linear regression to predict the selling price of a used car, in thousands of dollars, based on the age of the car in years. A random sample of used cars was selected and the result of the regression analysis is shown below. SUMMARY OUTPUT Regression Statistics Multiple R 0.7885 R Square Adjusted R Square 0.6217 0.5461 Standard Error 1.4528 Observations ANOVA df S MS Significance F Regression 1 17.3464 17.3464 8.2182 0.0351 Residual 5 10.5536 2.1107 Total 6. 27.9 Coefficients Standard Error t Stat P-value Lower 95% Upper 95% Intercept 11.6881 1.2403 9.4237 0.0002 8.4999 14.8764 Age -0.5072 0.1769 -2.8667 0.0351 -0.9620 -0.0524 Use the given information and select the fitted model for the relationship between age and price of used cars.


Correlation
Correlation defines a relationship between two independent variables. It tells the degree to which variables move in relation to each other. When two sets of data are related to each other, there is a correlation between them.
Linear Correlation
A correlation is used to determine the relationships between numerical and categorical variables. In other words, it is an indicator of how things are connected to one another. The correlation analysis is the study of how variables are related.
Regression Analysis
Regression analysis is a statistical method in which it estimates the relationship between a dependent variable and one or more independent variable. In simple terms dependent variable is called as outcome variable and independent variable is called as predictors. Regression analysis is one of the methods to find the trends in data. The independent variable used in Regression analysis is named Predictor variable. It offers data of an associated dependent variable regarding a particular outcome.


Trending now
This is a popular solution!

Step by step
Solved in 2 steps with 1 images


