Here is the Excel output for a multiple regression analysis. Study the ANOVA table, the t ratios, se, R, and adjusted R, and discuss the strengths and weaknesses of the model. Does this model appear to fit the data well? From the information here, what recommendations would you make about the predictor variables in the model?
Here is the Excel output for a multiple regression analysis. Study the ANOVA table, the t ratios, se, R, and adjusted R, and discuss the strengths and weaknesses of the model. Does this model appear to fit the data well? From the information here, what recommendations would you make about the predictor variables in the model?

College Algebra
7th Edition
ISBN:9781305115545
Author:James Stewart, Lothar Redlin, Saleem Watson
Publisher:James Stewart, Lothar Redlin, Saleem Watson
Chapter1: Equations And Graphs
Section: Chapter Questions
Problem 10T: Olympic Pole Vault The graph in Figure 7 indicates that in recent years the winning Olympic men’s...

Related questions

Topic Video
Question
Can you please solve all parts of the question manually. Thank you!
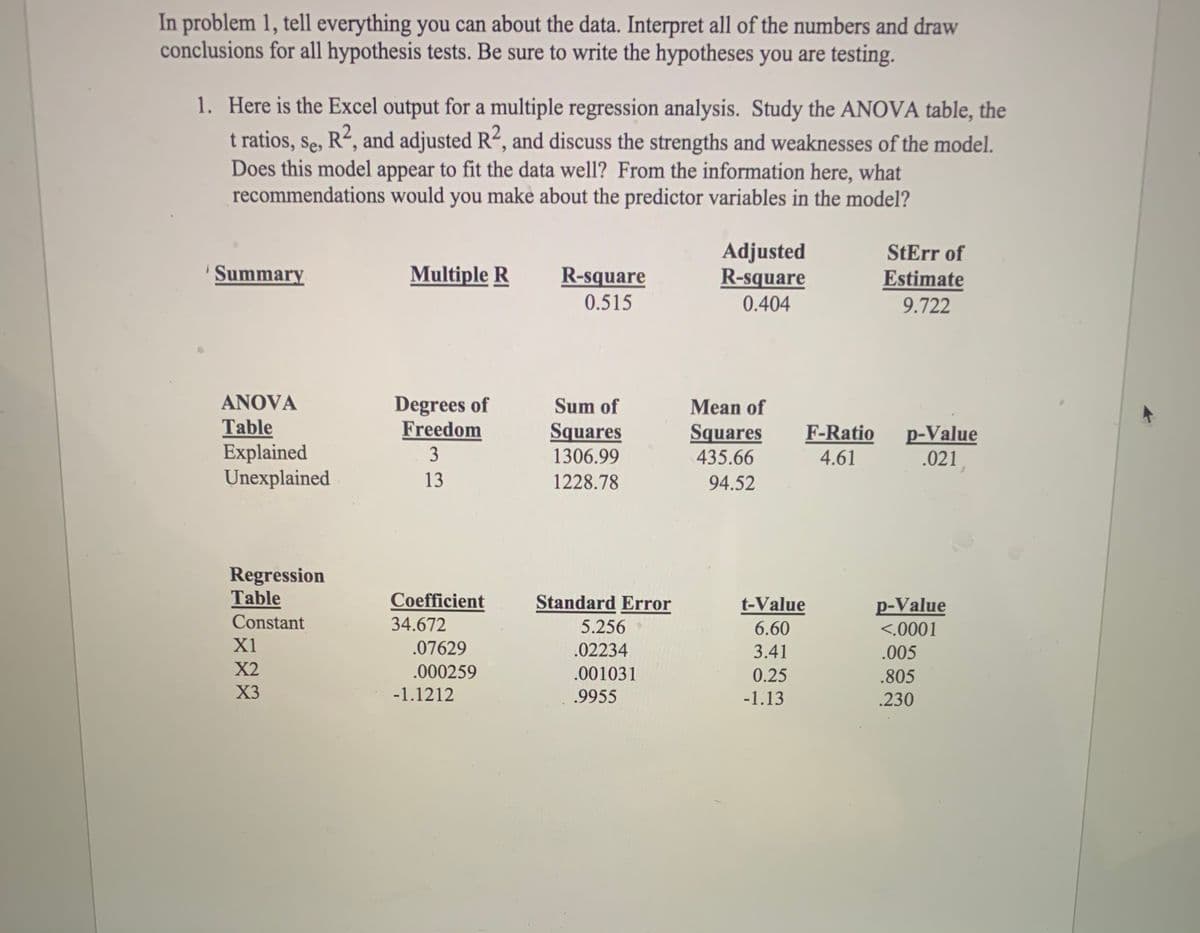
Transcribed Image Text:In problem 1, tell everything you can about the data. Interpret all of the numbers and draw
conclusions for all hypothesis tests. Be sure to write the hypotheses you are testing.
1. Here is the Excel output for a multiple regression analysis. Study the ANOVA table, the
t ratios, se, R“, and adjusted R“, and discuss the strengths and weaknesses of the model.
Does this model appear to fit the data well? From the information here, what
recommendations would you make about the predictor variables in the model?
Adjusted
R-square
0.404
StErr of
Summary
Multiple R
R-square
Estimate
0.515
9.722
ANOVA
Degrees of
Freedom
Sum of
Mean of
Table
Explained
Unexplained
Squares
1306.99
Squares
435.66
F-Ratio
p-Value
.021
3
4.61
13
1228.78
94.52
Regression
Table
Constant
Coefficient
Standard Error
t-Value
p-Value
34.672
5.256
6.60
<.0001
X1
.07629
.02234
3.41
.005
X2
.000259
.001031
0.25
.805
X3
-1.1212
.9955
-1.13
.230
Expert Solution
This question has been solved!
Explore an expertly crafted, step-by-step solution for a thorough understanding of key concepts.

Step by step
Solved in 2 steps

Knowledge Booster


Learn more about
Need a deep-dive on the concept behind this application? Look no further. Learn more about this topic, statistics and related others by exploring similar questions and additional content below.Recommended textbooks for you
College Algebra
Algebra
ISBN:
9781305115545
Author:
James Stewart, Lothar Redlin, Saleem Watson
Publisher:
Cengage Learning
College Algebra
Algebra
ISBN:
9781305115545
Author:
James Stewart, Lothar Redlin, Saleem Watson
Publisher:
Cengage Learning