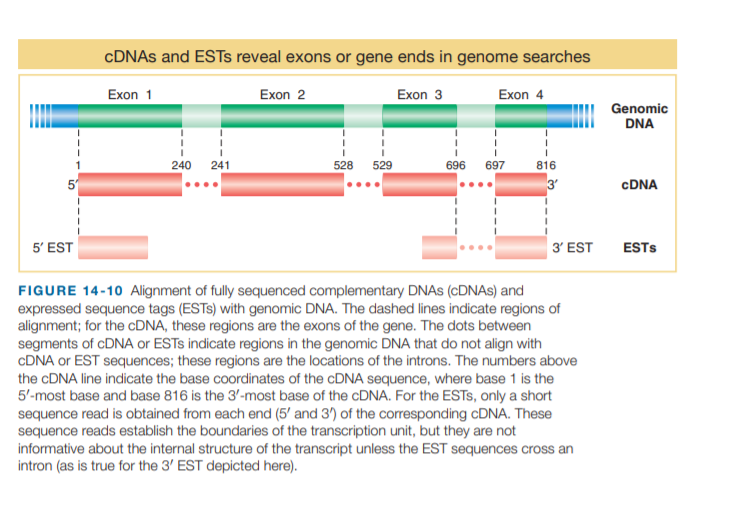
CDNAS and ESTS reveal exons or gene ends in genome searches Exon 2 Exon 1 Exon 3 Exon 4 Genomic DNA 240 241 528 529 696 697 816 3 CDNA 5' EST 3' EST ESTS FIGURE 14-10 Alignment of fully sequenced complementary DNAS (CDNAS) and expressed sequence tags (ESTS) with genomic DNA. The dashed lines indicate regions of alignment; for the CDNA, these regions are the exons of the gene. The dots between segments of CDNA or ESTS indicate regions in the genomic DNA that do not align with CDNA or EST sequences; these regions are the locations of the introns. The numbers above the CDNA line indicate the base coordinates of the CDNA sequence, where base 1 is the 5'-most base and base 816 is the 3'-most base of the CDNA. For the ESTS, only a short sequence read is obtained from each end (5' and 3') of the corresponding CDNA. These sequence reads establish the boundaries of the transcription unit, but they are not informative about the internal structure of the transcript unless the EST sequences cross an intron (as is true for the 3' EST depicted here).
CDNAS and ESTS reveal exons or gene ends in genome searches Exon 2 Exon 1 Exon 3 Exon 4 Genomic DNA 240 241 528 529 696 697 816 3 CDNA 5' EST 3' EST ESTS FIGURE 14-10 Alignment of fully sequenced complementary DNAS (CDNAS) and expressed sequence tags (ESTS) with genomic DNA. The dashed lines indicate regions of alignment; for the CDNA, these regions are the exons of the gene. The dots between segments of CDNA or ESTS indicate regions in the genomic DNA that do not align with CDNA or EST sequences; these regions are the locations of the introns. The numbers above the CDNA line indicate the base coordinates of the CDNA sequence, where base 1 is the 5'-most base and base 816 is the 3'-most base of the CDNA. For the ESTS, only a short sequence read is obtained from each end (5' and 3') of the corresponding CDNA. These sequence reads establish the boundaries of the transcription unit, but they are not informative about the internal structure of the transcript unless the EST sequences cross an intron (as is true for the 3' EST depicted here).

Biochemistry
6th Edition
ISBN:9781305577206
Author:Reginald H. Garrett, Charles M. Grisham
Publisher:Reginald H. Garrett, Charles M. Grisham
Chapter30: Protein Synthesis
Section: Chapter Questions
Problem 1P

Related questions

Question
In Figure 14-10, expressed sequence tags (ESTs) are
aligned with genomic sequence. How are ESTs helpful in
genome annotation?
Transcribed Image Text:CDNAS and ESTS reveal exons or gene ends in genome searches
Exon 2
Exon 1
Exon 3
Exon 4
Genomic
DNA
240
241
528
529
696
697
816
3
CDNA
5' EST
3' EST
ESTS
FIGURE 14-10 Alignment of fully sequenced complementary DNAS (CDNAS) and
expressed sequence tags (ESTS) with genomic DNA. The dashed lines indicate regions of
alignment; for the CDNA, these regions are the exons of the gene. The dots between
segments of CDNA or ESTS indicate regions in the genomic DNA that do not align with
CDNA or EST sequences; these regions are the locations of the introns. The numbers above
the CDNA line indicate the base coordinates of the CDNA sequence, where base 1 is the
5'-most base and base 816 is the 3'-most base of the CDNA. For the ESTS, only a short
sequence read is obtained from each end (5' and 3') of the corresponding CDNA. These
sequence reads establish the boundaries of the transcription unit, but they are not
informative about the internal structure of the transcript unless the EST sequences cross an
intron (as is true for the 3' EST depicted here).
Expert Solution
This question has been solved!
Explore an expertly crafted, step-by-step solution for a thorough understanding of key concepts.

Step by step
Solved in 2 steps

Knowledge Booster


Learn more about
Need a deep-dive on the concept behind this application? Look no further. Learn more about this topic, biology and related others by exploring similar questions and additional content below.Recommended textbooks for you
Biochemistry
Biochemistry
ISBN:
9781305577206
Author:
Reginald H. Garrett, Charles M. Grisham
Publisher:
Cengage Learning
Biochemistry
Biochemistry
ISBN:
9781305577206
Author:
Reginald H. Garrett, Charles M. Grisham
Publisher:
Cengage Learning