Cedar Valley Sales & Service's total revenue and net income for a five-year period follows 囲(Click on the icon to view the data.) Requirement 1.Calculate trend percentages for Cedar Valley Sales & Service's total revenue and net income for the five-year period, using year 0 as the base year. Round to the nearest full percent. Which grew faster during the period, total revenue or net income? Year 4 Year 3 Year 2 Year 1 Year 0 Total revenue Net income Data Table Year 4 Year 3 Year 2 Year 1 Year 0 (In thousands) Total revenue Net income 1,302 172 $1,975 $ 1,725 $1,630$ 1,462 $ 256 225 196 180 Print Done
Cedar Valley Sales & Service's total revenue and net income for a five-year period follows 囲(Click on the icon to view the data.) Requirement 1.Calculate trend percentages for Cedar Valley Sales & Service's total revenue and net income for the five-year period, using year 0 as the base year. Round to the nearest full percent. Which grew faster during the period, total revenue or net income? Year 4 Year 3 Year 2 Year 1 Year 0 Total revenue Net income Data Table Year 4 Year 3 Year 2 Year 1 Year 0 (In thousands) Total revenue Net income 1,302 172 $1,975 $ 1,725 $1,630$ 1,462 $ 256 225 196 180 Print Done

Managerial Accounting: The Cornerstone of Business Decision-Making
7th Edition
ISBN:9781337115773
Author:Maryanne M. Mowen, Don R. Hansen, Dan L. Heitger
Publisher:Maryanne M. Mowen, Don R. Hansen, Dan L. Heitger
Chapter15: Financial Statement Analysis
Section: Chapter Questions
Problem 40E: Cuneo Companys income statements for the last 3 years are as follows: Refer to the information for...

Related questions

Question
Answer all questions.
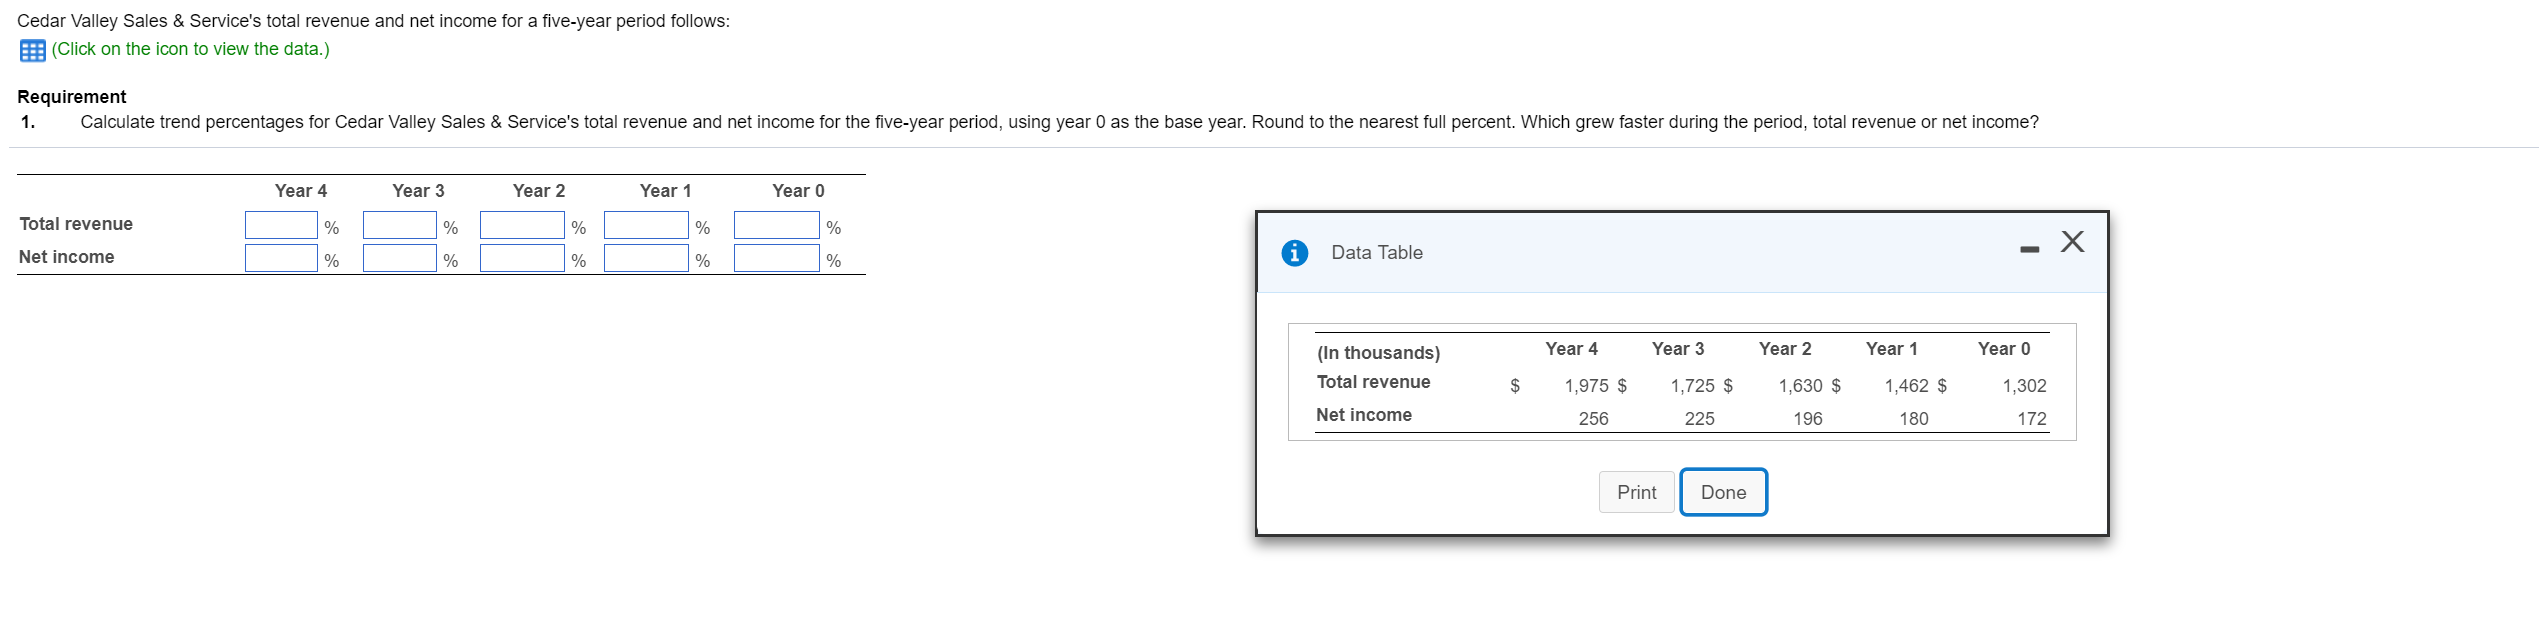
Transcribed Image Text:Cedar Valley Sales & Service's total revenue and net income for a five-year period follows
囲(Click on the icon to view the data.)
Requirement
1.Calculate trend percentages for Cedar Valley Sales & Service's total revenue and net income for the five-year period, using year 0 as the base year. Round to the nearest full percent. Which grew faster during the period, total revenue or net income?
Year 4
Year 3
Year 2
Year 1
Year 0
Total revenue
Net income
Data Table
Year 4
Year 3
Year 2
Year 1
Year 0
(In thousands)
Total revenue
Net income
1,302
172
$1,975 $ 1,725 $1,630$ 1,462 $
256
225
196
180
Print
Done
Expert Solution
This question has been solved!
Explore an expertly crafted, step-by-step solution for a thorough understanding of key concepts.

This is a popular solution!

Trending now
This is a popular solution!

Step by step
Solved in 4 steps with 2 images

Knowledge Booster


Learn more about
Need a deep-dive on the concept behind this application? Look no further. Learn more about this topic, accounting and related others by exploring similar questions and additional content below.Recommended textbooks for you
Managerial Accounting: The Cornerstone of Busines…
Accounting
ISBN:
9781337115773
Author:
Maryanne M. Mowen, Don R. Hansen, Dan L. Heitger
Publisher:
Cengage Learning

Managerial Accounting
Accounting
ISBN:
9781337912020
Author:
Carl Warren, Ph.d. Cma William B. Tayler
Publisher:
South-Western College Pub

Managerial Accounting: The Cornerstone of Busines…
Accounting
ISBN:
9781337115773
Author:
Maryanne M. Mowen, Don R. Hansen, Dan L. Heitger
Publisher:
Cengage Learning
Managerial Accounting
Accounting
ISBN:
9781337912020
Author:
Carl Warren, Ph.d. Cma William B. Tayler
Publisher:
South-Western College Pub

College Accounting, Chapters 1-27
Accounting
ISBN:
9781337794756
Author:
HEINTZ, James A.
Publisher:
Cengage Learning,

Financial Accounting
Accounting
ISBN:
9781337272124
Author:
Carl Warren, James M. Reeve, Jonathan Duchac
Publisher:
Cengage Learning