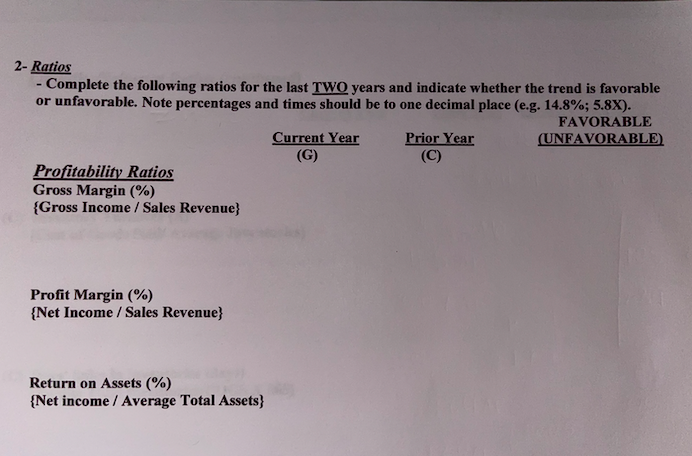
2- Ratios - Complete the following ratios for the last TWO years and indicate whether the trend is favorable or unfavorable. Note percentages and times should be to one decimal place (e.g. 14.8%; 5.8X). FAVORABLE Current Year (G) Prior Year (C) (UNFAVORABLE) Profitability Ratios Gross Margin (%) {Gross Income / Sales Revenue} Profit Margin (%) {Net Income / Sales Revenue} Return on Assets (%) {Net income / Average Total Assets}
2- Ratios - Complete the following ratios for the last TWO years and indicate whether the trend is favorable or unfavorable. Note percentages and times should be to one decimal place (e.g. 14.8%; 5.8X). FAVORABLE Current Year (G) Prior Year (C) (UNFAVORABLE) Profitability Ratios Gross Margin (%) {Gross Income / Sales Revenue} Profit Margin (%) {Net Income / Sales Revenue} Return on Assets (%) {Net income / Average Total Assets}
Fundamentals of Financial Management (MindTap Course List)
15th Edition
ISBN:9781337395250
Author:Eugene F. Brigham, Joel F. Houston
Publisher:Eugene F. Brigham, Joel F. Houston
Chapter4: Analysis Of Financial Statements
Section: Chapter Questions
Problem 24P: Income Statement for Year Ended December 31, 2018 (Millions of Dollars) Net sales 795.0 Cost of...
Related questions
Question
2) Ratios
Based on the information given in picture #1, complete the following ratios for the last TWO years and indicate whether the trend is favorable or unfavorable. Note percentages and times should be to one decimal place (e.g. 14.8%; 5.8x)
Profitability Ratios Current Yr. Prior Yr. Fav/Unfav.
Gross Margin (%)
{Gross Income/Sales Revenue}
Profit Margin (%)
{Net income/ Sales Revenue}
Return on Assets (%)
{Net Income/ Average Total Assets}

Transcribed Image Text:2- Ratios
Complete the following ratios for the last TWO years and indicate whether the trend is favorable
or unfavorable. Note percentages and times should be to one decimal place (e.g. 14.8%; 5.8X).
FAVORABLE
Current Year
(G)
Prior Year
(C)
(UNFAVORABLE)
Profitability Ratios
Gross Margin (%)
{Gross Income / Sales Revenue}
Profit Margin (%)
{Net Income / Sales Revenue}
Return on Assets (%)
{Net income / Average Total Assets}

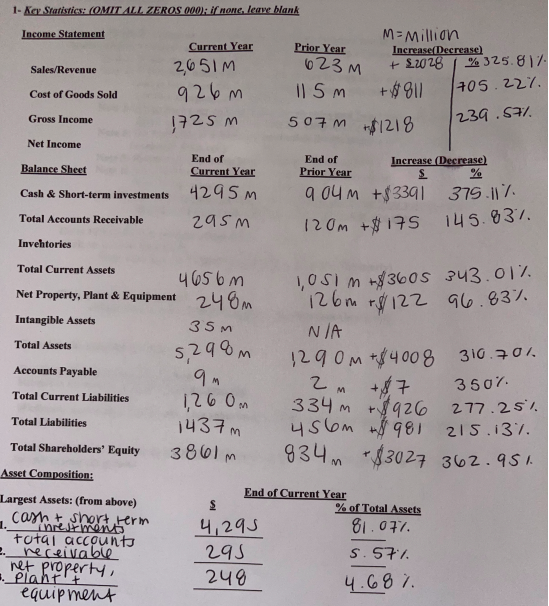
Transcribed Image Text:1- Key Statistics: (OMIT ALL ZEROS 000): if none, leave blank
Income Statement
Prior Year
623 M
Current Year
Increase(Decrease)
2651M
+ £2028
% 325.81%.
Sales/Revenue
926m
705.22%.
Cost of Goods Sold
1725 M
507m m$1218
239.571.
Gross Income
Net Income
End of
Increase (Decrease)
S.
End of
Balance Sheet
Current Year
Prior Year
4295M
9 04 m +$339l 375.17
Cash & Short-term investments
Total Accounts Receivable
295M
145.837.
120m +$175
Invehtories
1,OSIM 360s 343.01%.
126m rý122 96.83%.
Total Current Assets
4656m
Net Property, Plant & Equipment 24 8m
Intangible Assets
35M
N IA
Total Assets
5,298M
129 0m tf4008 310.701.
Accounts Payable
3507.
Total Current Liabilities
126 0m
1437m
334 m r926 277.25.
456m 9 215.13%.
834m 3027 362.951.
Total Liabilities
Total Shareholders' Equity
3861 m
*$3027
Asset Composition:
End of Current Year
Largest Assets: (from above)
Cah + short term
nrestments
tutal accounts
e_receivable
ret property,
% of Total Assets
4,295
295
248
81.077.
S. 57%.
Plaht'i
equip ment
4.68 7.
Expert Solution
This question has been solved!
Explore an expertly crafted, step-by-step solution for a thorough understanding of key concepts.
This is a popular solution!
Trending now
This is a popular solution!
Step by step
Solved in 2 steps with 2 images

Knowledge Booster
Learn more about
Need a deep-dive on the concept behind this application? Look no further. Learn more about this topic, accounting and related others by exploring similar questions and additional content below.Recommended textbooks for you

Fundamentals of Financial Management (MindTap Cou…
Finance
ISBN:
9781337395250
Author:
Eugene F. Brigham, Joel F. Houston
Publisher:
Cengage Learning

College Accounting, Chapters 1-27
Accounting
ISBN:
9781337794756
Author:
HEINTZ, James A.
Publisher:
Cengage Learning,

Fundamentals of Financial Management (MindTap Cou…
Finance
ISBN:
9781337395250
Author:
Eugene F. Brigham, Joel F. Houston
Publisher:
Cengage Learning

College Accounting, Chapters 1-27
Accounting
ISBN:
9781337794756
Author:
HEINTZ, James A.
Publisher:
Cengage Learning,