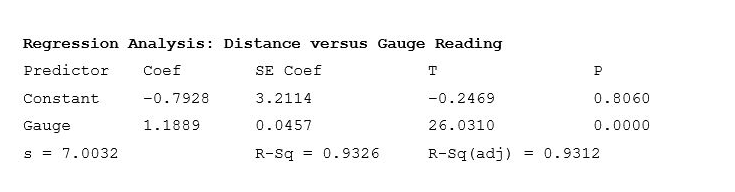
Certain car manufacturers install a gauge that tells the driver how many miles they can drive until they will run out of gas. A study was conducted to test the accuracy of these gauges. Each driver was assigned a certain gauge reading until empty to watch for. When their car announced it had that many miles remaining until empty, they began to measure their distance traveled. After they ran out of gas, they reported the distance they were able to drive (in miles) as well as the gauge reading they were assigned (in miles). Here is computer output showing the regression analysis: Identify and interpret the slope of the regression line used for predicting the actual distance that can be driven based on the gauge reading. (A) Slope = 1.1889. The predicted distance the drivers were able to drive increases by 1.1889 miles for each additional mile reported by the gauge. (B) Slope = 0.0457. The predicted distance the drivers were able to drive increases by 0.0457 miles for each additional mile reported by the gauge. (C) Slope = –0.7928. The predicted distance the drivers were able to drive decreases by 0.7928 miles for each additional mile reported by the gauge. (D) Slope = 1.1889. For each additional mile reported by the gauge, the drivers were able to drive an additional 1.1889 miles. (E) Slope = 0.0457. For each additional mile reported by the gauge, the drivers were able to drive an additional 0.0457 miles.


Unitary Method
The word “unitary” comes from the word “unit”, which means a single and complete entity. In this method, we find the value of a unit product from the given number of products, and then we solve for the other number of products.
Speed, Time, and Distance
Imagine you and 3 of your friends are planning to go to the playground at 6 in the evening. Your house is one mile away from the playground and one of your friends named Jim must start at 5 pm to reach the playground by walk. The other two friends are 3 miles away.
Profit and Loss
The amount earned or lost on the sale of one or more items is referred to as the profit or loss on that item.
Units and Measurements
Measurements and comparisons are the foundation of science and engineering. We, therefore, need rules that tell us how things are measured and compared. For these measurements and comparisons, we perform certain experiments, and we will need the experiments to set up the devices.
Certain car manufacturers install a gauge that tells the driver how many miles they can drive until they will run out of gas. A study was conducted to test the accuracy of these gauges. Each driver was assigned a certain gauge reading until empty to watch for. When their car announced it had that many miles remaining until empty, they began to measure their distance traveled. After they ran out of gas, they reported the distance they were able to drive (in miles) as well as the gauge reading they were assigned (in miles). Here is computer output showing the
Identify and interpret the slope of the regression line used for predicting the actual distance that can be driven based on the gauge reading.
- (A) Slope = 1.1889. The predicted distance the drivers were able to drive increases by 1.1889 miles for each additional mile reported by the gauge.
- (B) Slope = 0.0457. The predicted distance the drivers were able to drive increases by 0.0457 miles for each additional mile reported by the gauge.
- (C) Slope = –0.7928. The predicted distance the drivers were able to drive decreases by 0.7928 miles for each additional mile reported by the gauge.
- (D) Slope = 1.1889. For each additional mile reported by the gauge, the drivers were able to drive an additional 1.1889 miles.
- (E) Slope = 0.0457. For each additional mile reported by the gauge, the drivers were able to drive an additional 0.0457 miles.


Trending now
This is a popular solution!

Step by step
Solved in 2 steps with 1 images


