ch My Drive - Google Drive GA random sample of 100 COS X Math 21 Final Fall 2009 In Person Final ers/chasejamescanterbury/Dropbox/Online%20Final%20Exam%20F19.pdf 
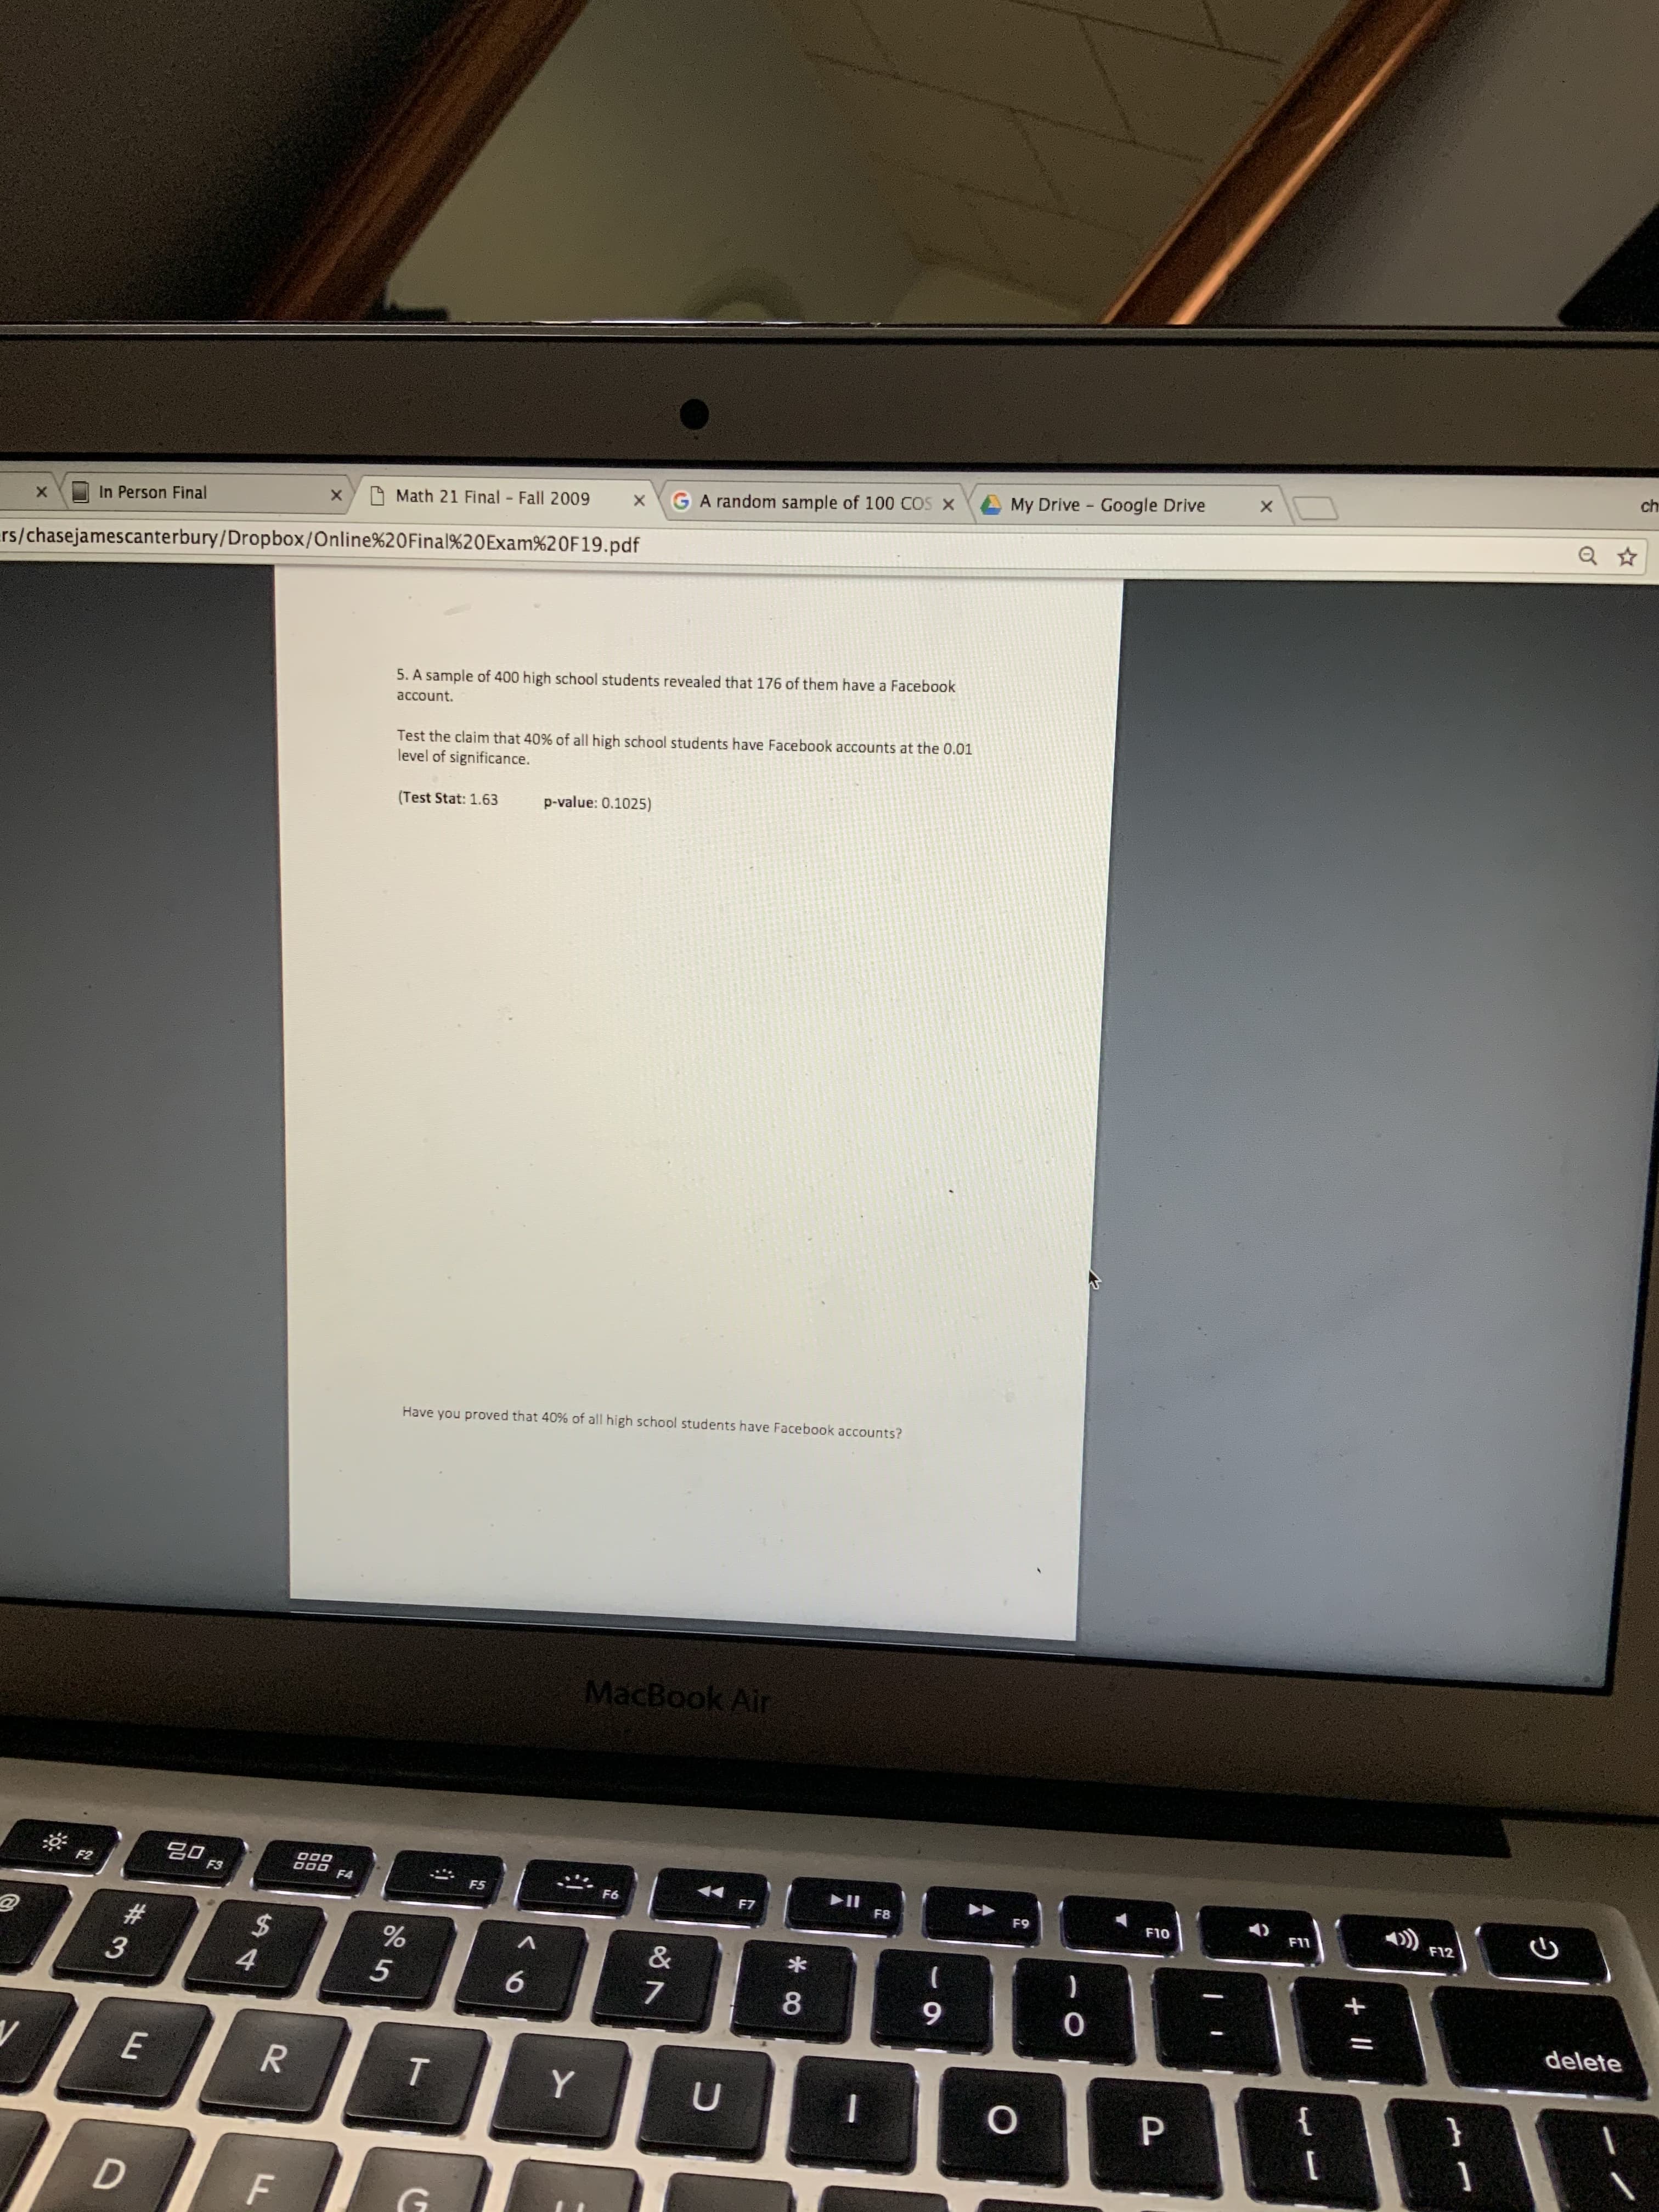
5. A sample of 400 high school students revealed that 176 of them have a Facebook account. Test the claim that 40% of all high school students have Facebook accounts at the 0.01 level of significance. p-value: 0.1025) (Test Stat: 1.63 Have you proved that 40% of all high school students have Facebook accounts? MacBook Air F2 F3 F4 F5 F6 F7 F8 F9 F10 F11 F12 %23 %24 4 8. 9. delete { T.
Q: I want to assess whether different types of movies increase viewers’ stress response. I recruit 24…
A: f. Between degrees of freedom is 2. Error degrees of freedom is 21 Level of significance is 0.05.…
Q: 7. In this specific scenario, are the two variables of interest? Which is the IV and which is the…
A: According to the answering guidelines, we can answer only three subparts of a question and the rest…
Q: A paired difference experiment yielded the results shown below. na = 45 Xd = 16.4 a. Test Ho: Hd =…
A:
Q: For 50 randomly selected speed dates, attractiveness ratings by males of their female date…
A: Given, The 50 paired ratings yield x=6.3, y=6.0, r=−0.264, P-value=0.063, and y=7.92−0.304x.
Q: A band limited white noise has a single sided PSD of 100 over the frequency range of 1 to 26 hz.…
A: Given: PSD is 100
Q: For an alpha = .10 and degrees of freedom, df = 32, what is the one-tailed t-value? Give your answer…
A: According to the provided information, Singificacne level (α) = 0.10 Degrees of freedom (df) = 32
Q: Consider the following scatter diagram: 25 20 15 10 Initial Which of the following best describes…
A: A scatter plot is given between initial and final temperatures.
Q: Using the information provided in the SPSS output. You are asked to make a decision about whether to…
A: Answer A. Since the p-value is larger than alpha, you do not reject the null hypothesis
Q: 8 F. b| 13 ョ|^,黑, I Normal T Aa A AaBbCcI AaBbCcI AABBCCD AaB AaBbCcI I No Spac... Heading 2…
A: As given in the test, we need to find if, the elderly people who own pets are equally likely to…
Q: Answer the whole page for number four please.
A: The null and the alternative hypotheses are given below:H0: The mean sales before and after the…
Q: Answer the whole page nine please.
A: The mean, standard deviation and sample size of foreign cars are given as follows:
Q: 13 Find out the likely production corresponding to a rainfall of 40 cms. from the following data :…
A: Regression Equation: When we want to predict the value of one variable, say Y, from the given value…
Q: For 50 randomly selected speed dates, attractiveness ratings by males of their female date…
A: Decision Rule for hypothesis testing : During a statistical test, the p- value helps us determine…
Q: In the figure below, How many measurements in a data set that subject to a random error and lies in…
A: We've to find that, P(-2.38<Z<2.36)' =1- P(-2.38<Z)- P(Z<2.36) =1-…
Q: d. Calculate the test statistic as identified in "c" above. e. What is the p value associated with…
A: The sample size is 200, sample mean is 75, sample standard deviation is 20, and population mean is…
Q: A sample of men and women who had passed their driver's test either the first time or the second…
A:
Q: B 4. Two of the bulbs in a sample of 30 were defective. If the sample was representative, find the…
A: Given two of the bulbs in a sample of 30 were defective.
Q: For 50 randomly selected speed dates, attractiveness ratings by males of their female date partners…
A: Given, The regression equation is, The objective is to find the best predicted value of y^…
Q: Answer the whole page for number eight please.
A: The null and the alternative hypotheses are given below:H0: The mean assembly time taken by two…
Q: answer b The following table shows the number of shirts by sizes that are manufactured in a factory…
A: The different level of measurement is given as follows- Nominal scale: It is the categorical…
Q: A research center claims that more than 29% of employees in a certain country have changed jobs in…
A: Hey there! Thank you for posting the question. Since your question has more than 3 parts, we are…
Q: f. What is our critical F value (from table)? g. Fill in the ANOVA summary table with your data Sum…
A:
Q: A band limited white noise has a single sided PSD of 100 over the frequency range of 1 to 26 hz.…
A: Given: Variance of PSD is 100
Q: The accompanying summary quantities for x = Particulate pollution (ug/m) and y = Luminance (0.01…
A: The test statistics t score is calculated using the formula, t=rn-21-r2. Where, r is the correlation…
Q: The director of an alumni association wants to determine whether there is any type of relationship…
A:
Q: Solves all steps of question one.
A: The following cross tablulation have been provided.
Q: Find the critical values of Z for a two tail test at alpha a = 0.05 LOS. Click this link for Normal…
A:
Q: In the figure below, How many measurements in a data set that subject to a random error and lies in…
A: Here we've to find, P(-1.38<Z<1.66) = P(-1.38<Z)+ P(Z<1.66) = P(Z<1.38)+P(Z<1.66)
Q: C4. Suppose we used General Social Survey data to examine the relationship between educational…
A: C4. The obtained chi-square is 40.43, and alpha is 0.05.
Q: 11. Find out the likely production corresponding to a rainfall of 40 cms. from the following data:…
A: Regression equation : The equation is written as Y= a + bX, wherever Y is that the variable (the…
Q: Given the auto correlation function for a stationary ergodic process with no periodic components is…
A:
Q: A band limited white noise has a single sided PSD of 100 over the frequency range of 1 to 26 hz.…
A: Given : White noise has a single sided PSD of 100 over frequency range of 1 to 26 hz. PSD = 100
Q: For an alpha = .10 and degrees of freedom, df = 32, what is the one-tailed t-value? Give your answer…
A: Given,α=0.10and degrees of freedom(df)=32
Q: Answer the whole page for number seven please.
A: In this case, the chi-square goodness of fit test is appropriate.The null and alternative hypotheses…
Q: For item d, use the decision below as your reference. The null hypothesis was not rejected, and it…
A: The following information has been given: Null Hypothesis : there is no impact of organic food on…
Q: Consider the model defined by, wage; = Bo + B1 educ; + B2 age; + B3 tenure; + uj for 15 years of…
A: Given : R2=0.577 SSample size =n=15 We need to find F-statistic.
Q: The article refered to in Exercise 1 also considered the effect of gypsum on the electric…
A:
Q: A research center claims that more than 29% of employees in a certain country have changed jobs in…
A: Hey there! Thank you for posting the question. Since your question has more than 3 parts, we are…
Q: An experiment was performed with seven hop plants. One half of each was pollinated and the other was…
A: Experiment was performed with seven hop plants : n1 =n2 = 7 Here , both sample are of small size ,…
Q: Q1. An anthropologist wants to collect data to determine whether the two different cultural groups…
A: The following information has been provided: Sample Mean 1 (Xˉ1)(\bar X_1) = 62.762.7 Sample…
Q: 4. Complete the Cronbrachs Alpha for: When you compute your alpha- then interpret is this score…
A: The value of Cronbach’s alpha is obtained using Minitab. Steps for which is shown as:Enter the data…
Q: A sample of 100 dry battery cells tested to find the length of life produced the tollowing results :…
A:
Q: In single-sample, upper-tail test hypothesis test, if the researcher changes the alpha level from…
A: Given: On considering the single sample on using the upper tail test hypothesis the researcher…
Q: Answer the whole page for number six please.
A: Given thatLevel of significance = 5%Sample of 66 males 50 are working.Sample of 81 females 49 are…
Q: As a bonus assignment a former student checked if your professor gave a statisticallysignificant…
A: We have to perform Z test for testing the difference in the proportion.
Q: Answer all of number two which is the whole page please.
A: The hypothesis can be constructed as:Null hypothesis, H0: The mean number of cases sold per week is…
Q: Please answer number 17.
A: From the given information, the claim of the problem is the proportion of COS students who own an…
Q: the ress m 5. Data from the Motor Vehicle Department indicate that 80% of all licensed drivers are…
A: Claim : the age distribution for this sample significantly different from the distribution for the…
Q: For 50 randomly selected speed dates, attractiveness ratings by males of their female date partners…
A: The p-value is 0.050.
Q: For 50 randomly selected speed dates, attractiveness ratings by males of their female date…
A: The P-value is 0.072.
Answer the whole page for number five please.
Trending now
This is a popular solution!
Step by step
Solved in 5 steps with 4 images
- A research center claims that 30% of adults in a certain country would travel into space on a commercial flight if they could afford it. In a random sample of 800 adults in that country, 34% say that they would travel into space on a commercial flight if they could afford it. At α=0.05, is there enough evidence to reject the research center's claim? Complete parts (a) through (d) below. (a) Identify the claim and state H0 and Ha. Let p be the population proportion of successes, where success is an adult in the country who would travel into space on a commercial flight if they could afford it. State H0 and Ha. Select the correct choice below and fill in the answer boxes to complete your choice. b) Use technology to find the P-value. Identify the standardized test statistic. Identify the P-value. (c) Decide whether to reject or fail to reject the null hypothesis and (d) interpret the decision in the context of the original claim.A Data analytics professor wants to know whether level of college education influences the grade earned by students in his course. Last semester, 400 students completed his class: 150 freshmen, 100 sophomores, 100 juniors, and 50 seniors. At end of the semester, 80 students earned an A, 148 earned a B, and 172 earned a C. The distribution of grades is shown in the following table. Do a chi-square test at alpha=0.05. What is the null hypothesis for this test? A. The letter grades of the students are significantly different. B. The letter grades of the students are dependent of the level of college education. C. The letter grades of the students are identical. D. The letter grades of the students are independent of the level of college education.A group of college students volunteered to participate in a study investigating the effect of sleep deprivation on fine motor tasks. Each student was assigned to each of two treatments: staying awake all night and getting a full night’s sleep. The next morning at 8:00 a.m., the students are asked to thread as many needles as possible in five minutes. The treatments are administered on the first Saturday of consecutive months, and the order of the treatments is assigned to each student at random. The data table shows the number of needles successfully threaded by each student. A 95% confidence interval for the mean difference in needles threaded is (1.33, 4.05). Based on this interval, should the researchers conclude that college students like the ones in this study thread the same number of needles when they are sleep deprived as when they are rested, on average? A. Yes, the confidence interval contains only positive values. B. Yes, one subject threaded more needles when…
- The management of the Seaside Golf Club regularly monitors the golfers on its course for speed of play. Suppose a random sample of golfers was taken in 2005 and another random sample of golfers was selected in 2006. The results of the two samples are as follows: 2005 2006 x1= 225 x2= 219 s1= 20.25 s2= 21.70 n1= 36 n2= 31 Based on the sample results, can the management of the Seaside Golf Course conclude that the average speed of play was different in 2006 than in 2005? Conduct the appropriate hypothesis test at the 0.10 level of significance. Assume that the management of the club is willing to accept the assumption that the populations of playing times for each year are approximately normally distributed.Based on information from a previous study, r1 = 38 people out of a random sample of n1 = 105 adult Americans who did not attend college believe in extraterrestrials. However, out of a random sample of n2 = 105 adult Americans who did attend college, r2 = 49 claim that they believe in extraterrestrials. Does this indicate that the proportion of people who attended college and who believe in extraterrestrials is higher than the proportion who did not attend college? Use α = 0.01. 1. What is the value of the sample test statistic? (Test the difference p1 − p2. Do not use rounded values. Round your final answer to two decimal places.) 2. Find (or estimate) the P-value. (Round your answer to four decimal places.)Based on information from a previous study, r1 = 34 people out of a random sample of n1 = 105 adult Americans who did not attend college believe in extraterrestrials. However, out of a random sample of n2 = 105 adult Americans who did attend college, r2 = 50 claim that they believe in extraterrestrials. Does this indicate that the proportion of people who attended college and who believe in extraterrestrials is higher than the proportion who did not attend college? Use ? = 0.01. (a) What is the level of significance?State the null and alternate hypotheses. H0: p1 = p2; H1: p1 ≠ p2H0: p1 < p2; H1: p1 = p2 H0: p1 = p2; H1: p1 < p2H0: p1 = p2; H1: p1 > p2 (b) What sampling distribution will you use? What assumptions are you making? The Student's t. The number of trials is sufficiently large.The standard normal. We assume the population distributions are approximately normal. The standard normal. The number of trials is sufficiently large.The Student's t. We assume the…
- Based on information from a previous study, r1 = 38 people out of a random sample of n1 = 106 adult Americans who did not attend college believe in extraterrestrials. However, out of a random sample of n2 = 106 adult Americans who did attend college, r2 = 52 claim that they believe in extraterrestrials. Does this indicate that the proportion of people who attended college and who believe in extraterrestrials is higher than the proportion who did not attend college? Use α = 0.01. (a) What is the level of significance? What is the value of the sample test statistic? (Test the difference p1 − p2. Do not use rounded values. Round your final answer to two decimal places.)(c) Find (or estimate) the P-value. (Round your answer to four decimal places.)The median pH level of the rain in a certain county, was 4.90. A biologist obtains a random sample of 19 rain dates and obtains the following data. Test the hypothesis that the median pH level has decreased from 4.90 at the alpha= 0.05 level of significance.A sample of men and women who had passed their driver's test either the first time or the second time were surveyed, with the following results: Results of the driving testGender First time Second timeMen 126 211Women 135 178a) Do these data suggest that there is a relationship between gender and the passing of their driver’s test from which the present sample was drawn? Let alpha=.05
- Based on information from a previous study, r1 = 37 people out of a random sample of n1 = 97 adult Americans who did not attend college believe in extraterrestrials. However, out of a random sample of n2 = 97 adult Americans who did attend college, r2 = 46 claim that they believe in extraterrestrials. Does this indicate that the proportion of people who attended college and who believe in extraterrestrials is higher than the proportion who did not attend college? Use α = 0.01. What is the value of the sample test statistic? (Test the difference p1 − p2. Do not use rounded values. Round your final answer to two decimal places.)(c) Find (or estimate) the P-value. (Round your answer to four decimal places.)The NAEP considers that a national average of 283 is an acceptable performance. Using α = .05, run a two-tail t-test for one sample to test Ho: µ=283 for the 2019 scores. Report the t-obt, df, and p-values. Would you reject the null hypothesis that the 2019 scores come from a population with average 283? If this is the case, does it come from a population from larger or smaller average?Within 2 miles No No No No No No No Yes No Yes No Yes No Yes Yes Yes No No No Yes Yes Yes Yes Yes No Yes No No Yes No No No No Yes Yes No Yes Yes Yes No No Yes Yes Yes Yes No No No No No A hunger-relief organization is trying to determine the lowest likely proportion of the local population that lives within two miles of a grocery store. A random sample of 50 local citizens was polled. Use Sheet 4 of the Excel file linked above to calculate p^ and the 95% confidence interval. p^= Upper bound for 95% confidence interval = Lower bound for 95% confidence interval = The organization can say with 95% confidence that the true population proportion of the local population that lives within two miles of a grocery store is in the interval [_____,_____]. The lowest likely proportion is ____