Chap 13 Simple Linear Regression 13. Plot the following straight lines. Give the values of the y-intercept and slope for each of these lines and interpret them. Indicate whether each of the lines gives a positive or a negative relationship between x and y. a. y= -60 + 8x b. y 300 -6x
Chap 13 Simple Linear Regression 13. Plot the following straight lines. Give the values of the y-intercept and slope for each of these lines and interpret them. Indicate whether each of the lines gives a positive or a negative relationship between x and y. a. y= -60 + 8x b. y 300 -6x

Chapter1: Equations, Inequalities, And Mathematical Modeling
Section1.2: Linear Equations In One Variable
Problem 6ECP: The number y (in thousands) of male participants in high school lacrosse in the United States from...

Related questions
Question
1
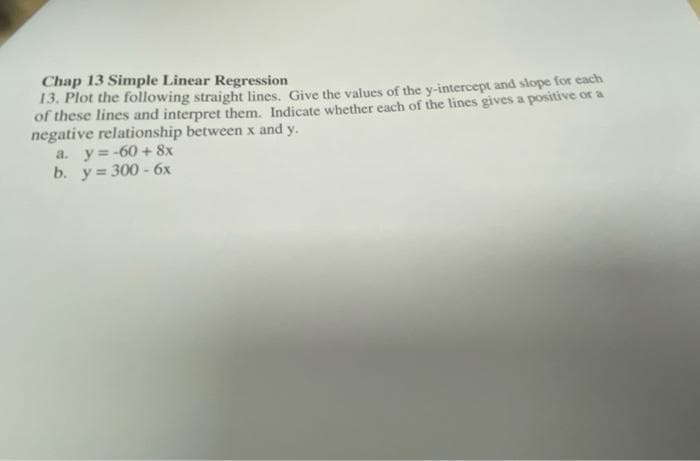
Transcribed Image Text:Chap 13 Simple Linear Regression
13. Plot the following straight lines. Give the values of the y-intercept and slope for each
of these lines and interpret them. Indicate whether each of the lines gives a positive or a
negative relationship between x and y.
a. y=-60 + 8x
b. y= 300 - 6x
Expert Solution
This question has been solved!
Explore an expertly crafted, step-by-step solution for a thorough understanding of key concepts.

Step by step
Solved in 2 steps with 2 images

Recommended textbooks for you

College Algebra (MindTap Course List)
Algebra
ISBN:
9781305652231
Author:
R. David Gustafson, Jeff Hughes
Publisher:
Cengage Learning

Glencoe Algebra 1, Student Edition, 9780079039897…
Algebra
ISBN:
9780079039897
Author:
Carter
Publisher:
McGraw Hill
College Algebra (MindTap Course List)
Algebra
ISBN:
9781305652231
Author:
R. David Gustafson, Jeff Hughes
Publisher:
Cengage Learning
Glencoe Algebra 1, Student Edition, 9780079039897…
Algebra
ISBN:
9780079039897
Author:
Carter
Publisher:
McGraw Hill

Algebra and Trigonometry (MindTap Course List)
Algebra
ISBN:
9781305071742
Author:
James Stewart, Lothar Redlin, Saleem Watson
Publisher:
Cengage Learning

Functions and Change: A Modeling Approach to Coll…
Algebra
ISBN:
9781337111348
Author:
Bruce Crauder, Benny Evans, Alan Noell
Publisher:
Cengage Learning

Intermediate Algebra
Algebra
ISBN:
9781285195728
Author:
Jerome E. Kaufmann, Karen L. Schwitters
Publisher:
Cengage Learning