Classify the variables as independent or dependent. 1. your grade in math and your test scores b Independent variable: Dependent variable: 2. the spread of the Covid-19 virus and breaking chains of transmission Independent variable: Dependent variable: 3. your habit of reading and your knowledge noltoon Independent variable: Dependent variable: 4. the number of boxes of pizza and its price Independent variable: Dependent variable: gidanoalor 5. the internet plan and internet bill of a household Independent variable: Dependent variable: oa onola svil on
Classify the variables as independent or dependent. 1. your grade in math and your test scores b Independent variable: Dependent variable: 2. the spread of the Covid-19 virus and breaking chains of transmission Independent variable: Dependent variable: 3. your habit of reading and your knowledge noltoon Independent variable: Dependent variable: 4. the number of boxes of pizza and its price Independent variable: Dependent variable: gidanoalor 5. the internet plan and internet bill of a household Independent variable: Dependent variable: oa onola svil on

Big Ideas Math A Bridge To Success Algebra 1: Student Edition 2015
1st Edition
ISBN:9781680331141
Author:HOUGHTON MIFFLIN HARCOURT
Publisher:HOUGHTON MIFFLIN HARCOURT
Chapter11: Data Analysis And Displays
Section11.4: Two-ways Tables
Problem 28E

Related questions
Topic Video
Question
100%
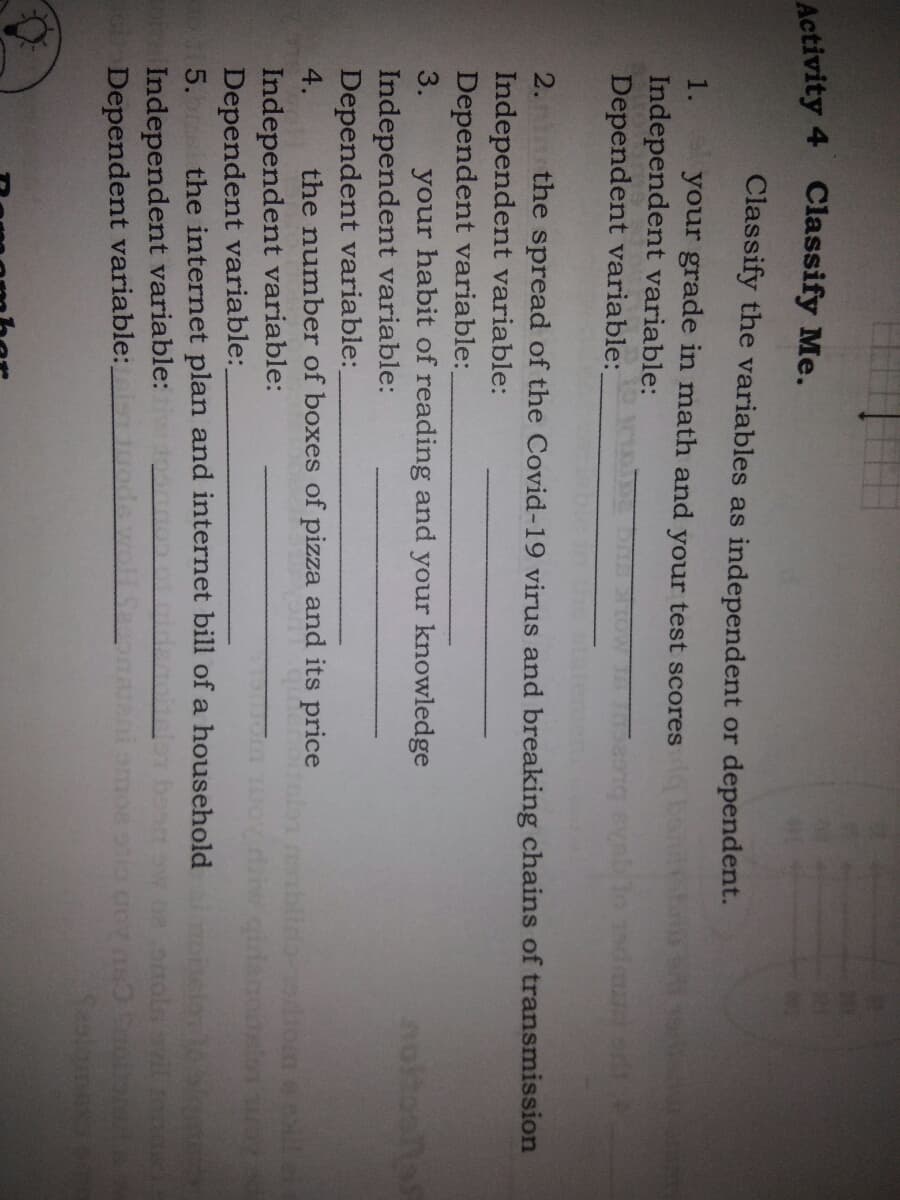
Transcribed Image Text:Activity 4 Classify Me.
Classify the variables as independent or dependent.
1.
your grade in math and your test scores be
Independent variable:
Dependent variable:
2. the spread of the Covid-19 virus and breaking chains of transmission
Independent variable:
Dependent variable:
3.
your habit of reading and your knowledge
noltoona
Independent variable:
Dependent variable:
4.
the number of boxes of pizza and its price
blida-
Independent variable:
Dependent variable:
5. the internet plan and internet bill of a household nelor
Independent variable:
Dependent variable:
Seslamex
Expert Solution
This question has been solved!
Explore an expertly crafted, step-by-step solution for a thorough understanding of key concepts.

This is a popular solution!

Trending now
This is a popular solution!

Step by step
Solved in 2 steps

Knowledge Booster


Learn more about
Need a deep-dive on the concept behind this application? Look no further. Learn more about this topic, statistics and related others by exploring similar questions and additional content below.Recommended textbooks for you
Big Ideas Math A Bridge To Success Algebra 1: Stu…
Algebra
ISBN:
9781680331141
Author:
HOUGHTON MIFFLIN HARCOURT
Publisher:
Houghton Mifflin Harcourt

Holt Mcdougal Larson Pre-algebra: Student Edition…
Algebra
ISBN:
9780547587776
Author:
HOLT MCDOUGAL
Publisher:
HOLT MCDOUGAL
Big Ideas Math A Bridge To Success Algebra 1: Stu…
Algebra
ISBN:
9781680331141
Author:
HOUGHTON MIFFLIN HARCOURT
Publisher:
Houghton Mifflin Harcourt
Holt Mcdougal Larson Pre-algebra: Student Edition…
Algebra
ISBN:
9780547587776
Author:
HOLT MCDOUGAL
Publisher:
HOLT MCDOUGAL