Conduct a vertical analysis (common-size financial statements). Comment on the components of the financial statements by year and its trend for the last three years. (Note: please see second picture as example for vertical analysis. The first picture is the given.)
Conduct a vertical analysis (common-size financial statements). Comment on the components of the financial statements by year and its trend for the last three years. (Note: please see second picture as example for vertical analysis. The first picture is the given.)

Cornerstones of Financial Accounting
4th Edition
ISBN:9781337690881
Author:Jay Rich, Jeff Jones
Publisher:Jay Rich, Jeff Jones
Chapter12: Fainancial Statement Analysis
Section: Chapter Questions
Problem 54CE

Related questions
Question
Conduct a vertical analysis (common-size financial statements). Comment on the components of the financial statements by year and its trend for the last three years.
(Note: please see second picture as example for vertical analysis. The first picture is the given.)
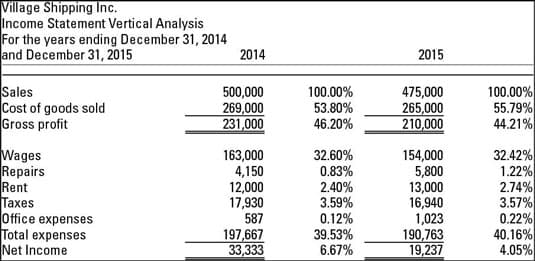
Transcribed Image Text:Village Shipping Inc.
Income Statement Vertical Analysis
For the years ending December 31, 2014
and December 31, 2015
2014
2015
Sales
Cost of goods sold
Gross profit
500,000
269,000
231,000
100.00%
53.80%
46.20%
475,000
265,000
210,000
100.00%
55.79%
44.21%
Wages
Repairs
Rent
Taxes
Office expenses
Total expenses
Net Income
163,000
4,150
12,000
17,930
587
32.60%
0.83%
2.40%
3.59%
0.12%
39.53%
6.67%
154,000
5,800
13,000
16,940
1,023
190,763
19,237
32.42%
1.22%
2.74%
3.57%
0.22%
40.16%
4.05%
197,667
33,333
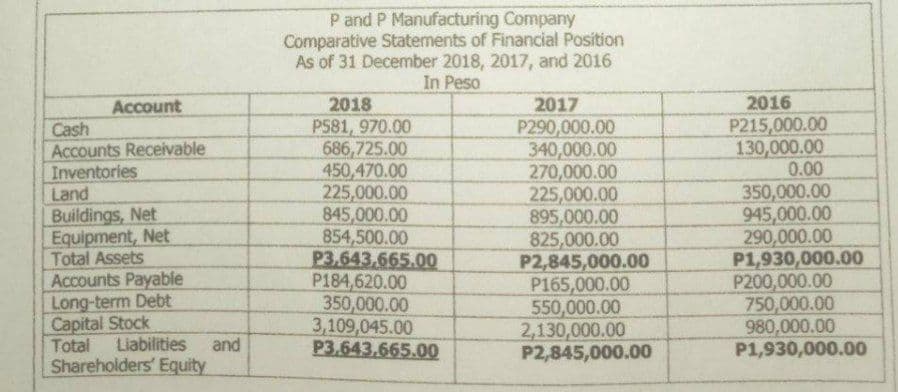
Transcribed Image Text:P and P Manufacturing Company
Comparative Statements of Financial Position
As of 31 December 2018, 2017, and 2016
In Peso
2018
P581, 970.00
686,725.00
450,470.00
225,000.00
845,000.00
854,500.00
P3.643,665.00
P184,620.00
350,000.00
3,109,045.00
P3.643.665.00
2016
2017
P290,000.00
340,000.00
270,000.00
225,000.00
895,000.00
825,000.00
P2,845,000.00
P165,000.00
550,000.00
2,130,000.00
P2,845,000.00
Account
P215,000.00
130,000.00
0.00
Cash
Accounts Receivable
Inventories
350,000.00
945,000.00
290,000.00
P1,930,000.00
P200,000.00
750,000.00
980,000.00
P1,930,000.00
Land
Buildings, Net
Equipment, Net
Total Assets
Accounts Payable
Long-term Debt
Capital Stock
Liabilities
Total
and
Shareholders' Equity
Expert Solution
This question has been solved!
Explore an expertly crafted, step-by-step solution for a thorough understanding of key concepts.

Step by step
Solved in 3 steps with 1 images

Knowledge Booster


Learn more about
Need a deep-dive on the concept behind this application? Look no further. Learn more about this topic, accounting and related others by exploring similar questions and additional content below.Recommended textbooks for you
Cornerstones of Financial Accounting
Accounting
ISBN:
9781337690881
Author:
Jay Rich, Jeff Jones
Publisher:
Cengage Learning

Intermediate Accounting: Reporting And Analysis
Accounting
ISBN:
9781337788281
Author:
James M. Wahlen, Jefferson P. Jones, Donald Pagach
Publisher:
Cengage Learning
Cornerstones of Financial Accounting
Accounting
ISBN:
9781337690881
Author:
Jay Rich, Jeff Jones
Publisher:
Cengage Learning
Intermediate Accounting: Reporting And Analysis
Accounting
ISBN:
9781337788281
Author:
James M. Wahlen, Jefferson P. Jones, Donald Pagach
Publisher:
Cengage Learning