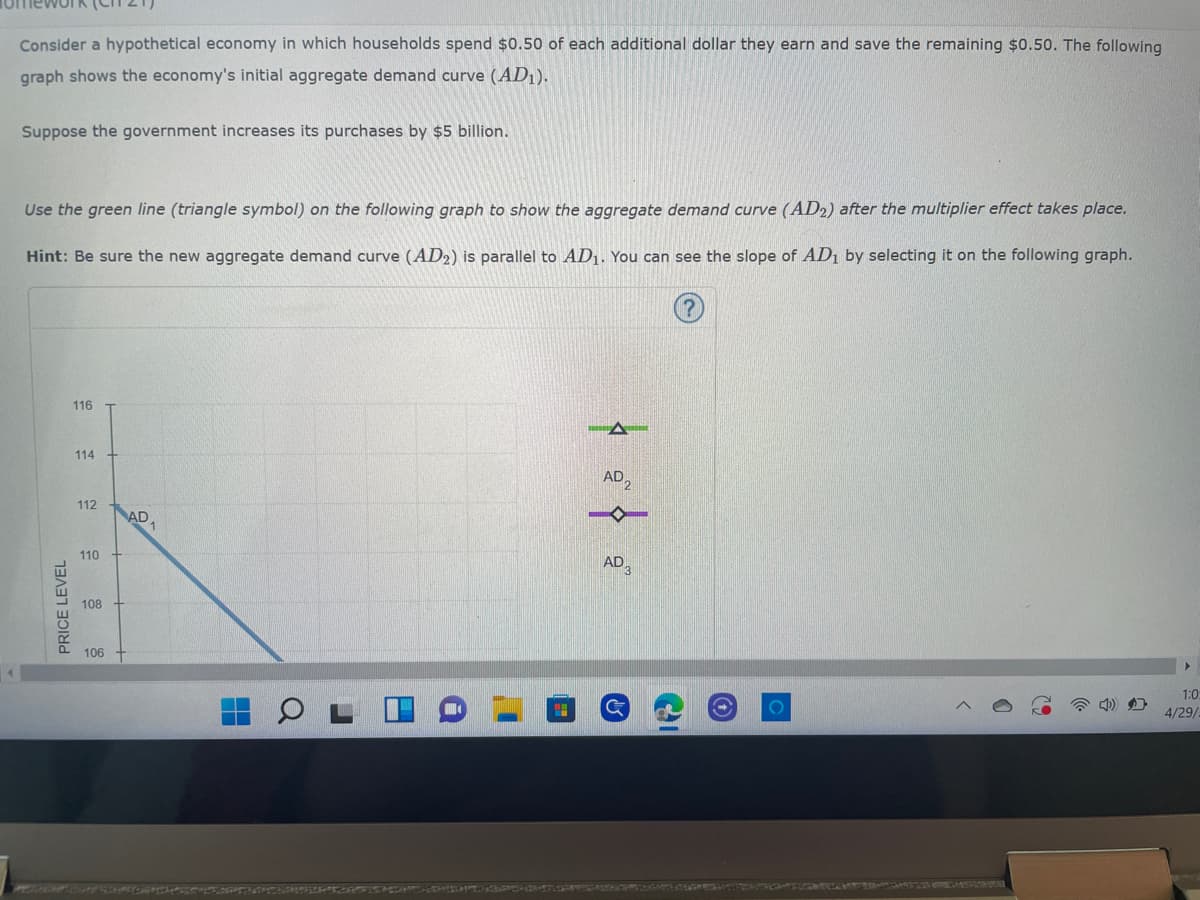
Consider a hypothetical economy in which households spend $0.50 of each additional dollar they earn and save the remaining $0.50. The following graph shows the economy's initial aggregate demand curve (AD₁). Suppose the government increases its purchases by $5 billion.
Consider a hypothetical economy in which households spend $0.50 of each additional dollar they earn and save the remaining $0.50. The following graph shows the economy's initial aggregate demand curve (AD₁). Suppose the government increases its purchases by $5 billion.

Chapter19: The Keynesian Model In Action
Section: Chapter Questions
Problem 7SQP

Related questions
Question
Transcribed Image Text:Consider a hypothetical economy in which households spend $0.50 of each additional dollar they earn and save the remaining $0.50. The following
graph shows the economy's initial aggregate demand curve (AD1).
Suppose the government increases its purchases by $5 billion.
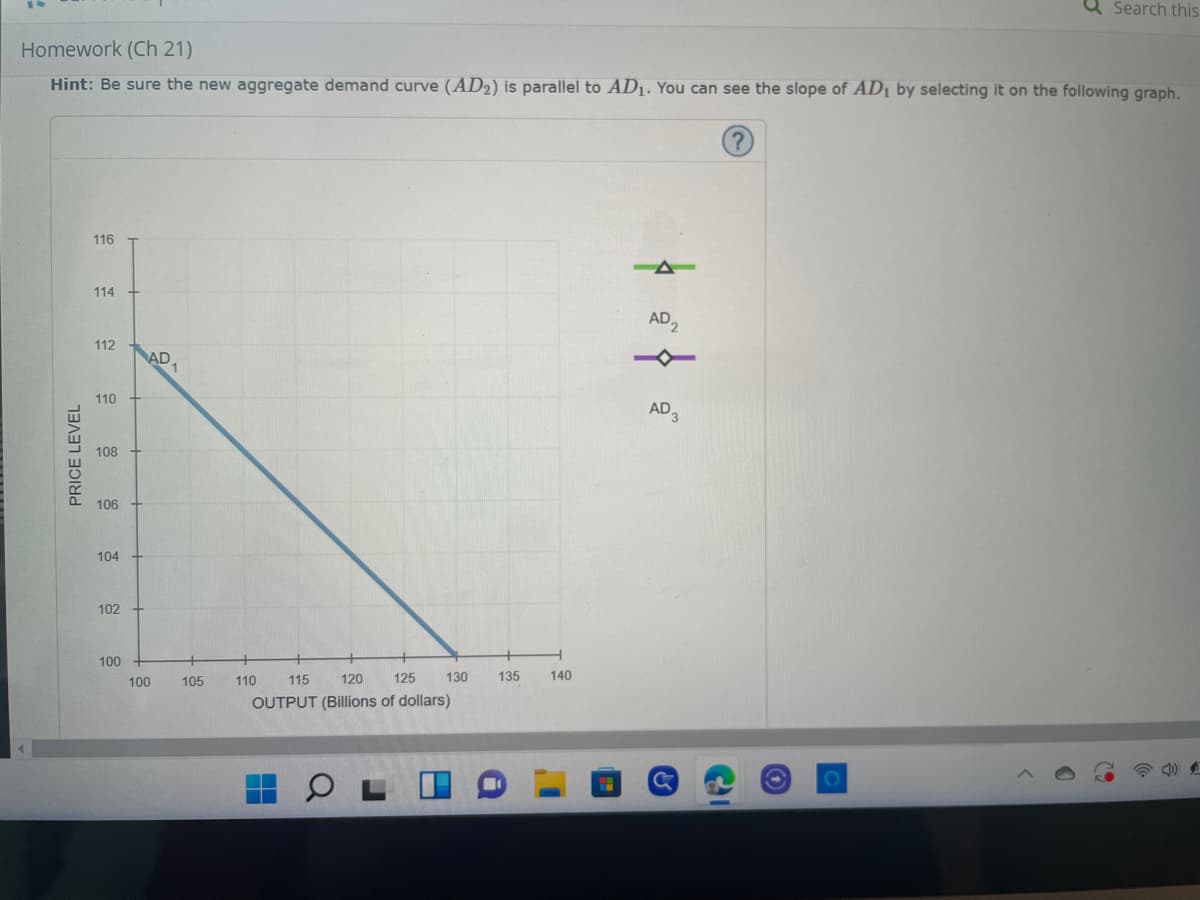
Use the green line (triangle symbol) on the following graph to show the aggregate demand curve (AD2) after the multiplier effect takes place.
Hint: Be sure the new aggregate demand curve (AD2) is parallel to AD₁. You can see the slope of AD1 by selecting it on the following graph.
116
114
AD₂
112
>
1:0
4/29/
PRICE LEVEL
MEADCA
110
108
AD1
A
AD 3
G
O
Transcribed Image Text:Search this
Homework (Ch 21)
Hint: Be sure the new aggregate demand curve (AD2) is parallel to AD₁. You can see the slope of AD₁ by selecting it on the following graph.
116
-
114
112
110
108
106
104
102
100
S
PRICE LEVEL
AD
100
1
105
110
115
120 125 130
OUTPUT (Billions of dollars)
135
140
AD2
AD 3
J
Expert Solution
This question has been solved!
Explore an expertly crafted, step-by-step solution for a thorough understanding of key concepts.

This is a popular solution!

Trending now
This is a popular solution!

Step by step
Solved in 2 steps with 1 images

Knowledge Booster


Learn more about
Need a deep-dive on the concept behind this application? Look no further. Learn more about this topic, economics and related others by exploring similar questions and additional content below.Recommended textbooks for you


Economics (MindTap Course List)
Economics
ISBN:
9781337617383
Author:
Roger A. Arnold
Publisher:
Cengage Learning