Consider the data. X; 2 6 9 13 20 YI 9 20 10 25 22 (a) What is the value of the standard error of the estimate? (Round your answer to three decimal places.) (b) Test for a significant relationship by using the t test. Use a = 0.05. State the null and alternative hypotheses. O Ho: B, + 0
Consider the data. X; 2 6 9 13 20 YI 9 20 10 25 22 (a) What is the value of the standard error of the estimate? (Round your answer to three decimal places.) (b) Test for a significant relationship by using the t test. Use a = 0.05. State the null and alternative hypotheses. O Ho: B, + 0

Algebra & Trigonometry with Analytic Geometry
13th Edition
ISBN:9781133382119
Author:Swokowski
Publisher:Swokowski
Chapter7: Analytic Trigonometry
Section7.6: The Inverse Trigonometric Functions
Problem 91E

Related questions
Question
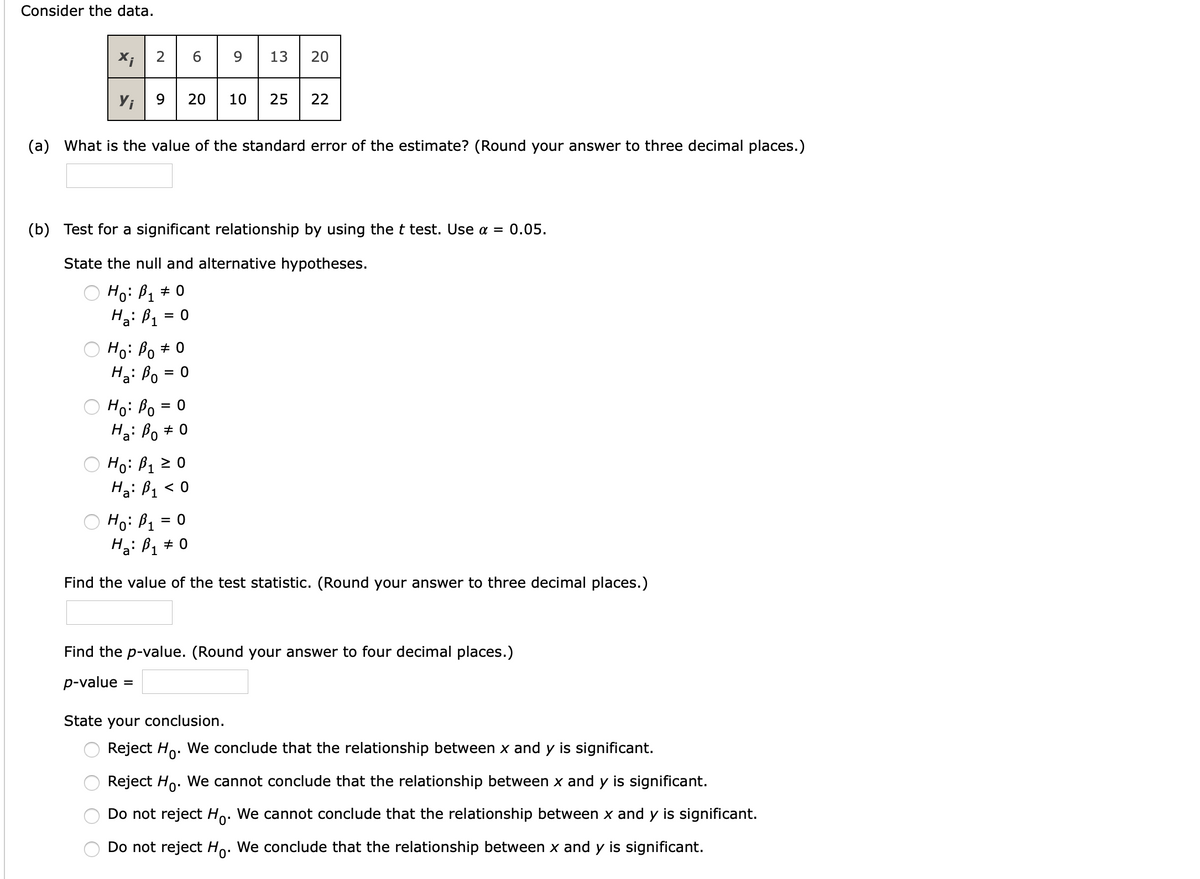
Transcribed Image Text:Consider the data.
x; 2 69
13
Y;| 9
20 10
25
22
(a) What is the value of the standard error of the estimate? (Round your answer to three decimal places.)
(b) Test for a significant relationship by using the t test. Use a = 0.05.
State the null and alternative hypotheses.
Ho: Bq # 0
Ha: B1
= 0
Ho: Bo + 0
Hai Po
= 0
Ho: Po = 0
Ho: Bo
Ha: Po
Ho: B1 2 0
Ha: B1 < 0
O Ho: B1 = 0
H: B, + 0
a
1
Find the value of the test statistic. (Round your answer to three decimal places.)
Find the p-value. (Round your answer to four decimal places.)
p-value
State your conclusion.
Reject Ho. We conclude that the relationship between x and y is significant.
Reject Ho. We cannot conclude that the relationship between x and y is significant.
Do not reject Ho. We cannot conclude that the relationship between x and y is significant.
Do not reject Ho: We conclude that the relationship between x and y is significant.
20
O O O
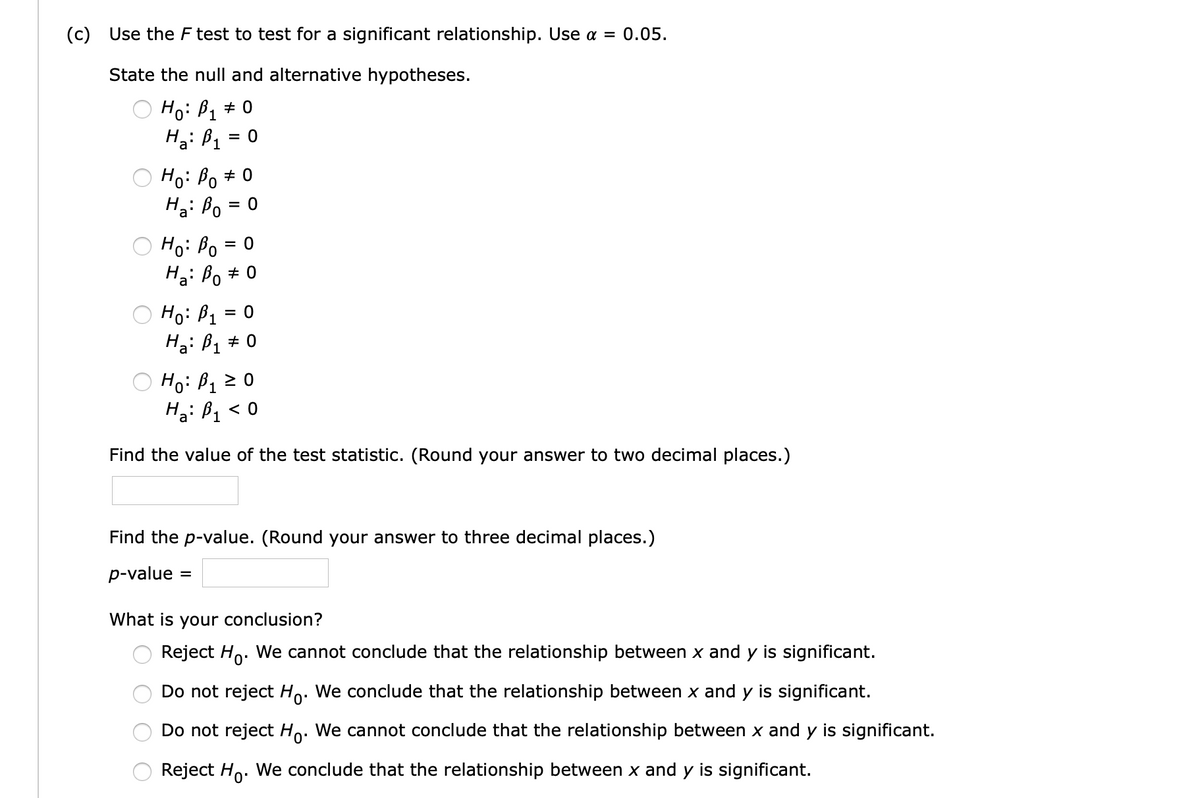
Transcribed Image Text:(c) Use the F test to test for a significant relationship. Use a =
0.05.
State the null and alternative hypotheses.
Ho: B1 + 0
Ha: B1
Ho: Bo + 0
Hai Bo
= 0
Ho: Bo
= 0
Ha: Bo + 0
O Ho: B1 = 0
H: B1 + 0
a'
O Ho: B1 2 0
Ha: B, < 0
Find the value of the test statistic. (Round your answer to two decimal places.)
Find the p-value. (Round your answer to three decimal places.)
p-value =
What is your conclusion?
Reject Ho. We cannot conclude that the relationship between x and y is significant.
Do not reject Ho. We conclude that the relationship between x and y is significant.
Do not reject Ho. We cannot conclude that the relationship between x and y is significant.
Reject Ho. We conclude that the relationship between x and y is significant.
Expert Solution
This question has been solved!
Explore an expertly crafted, step-by-step solution for a thorough understanding of key concepts.

This is a popular solution!

Trending now
This is a popular solution!

Step by step
Solved in 2 steps with 2 images

Knowledge Booster


Learn more about
Need a deep-dive on the concept behind this application? Look no further. Learn more about this topic, statistics and related others by exploring similar questions and additional content below.Recommended textbooks for you
Algebra & Trigonometry with Analytic Geometry
Algebra
ISBN:
9781133382119
Author:
Swokowski
Publisher:
Cengage
Algebra & Trigonometry with Analytic Geometry
Algebra
ISBN:
9781133382119
Author:
Swokowski
Publisher:
Cengage