Given are tive observations for two variables, a and y. 14 18 20 55 54 42 23 15 Use the estimated regression equation: ŷ = 68.1654 – 2.4488æ. a. Compute the mean square error using equation. SSE s? = MSE = n – 2 |(to 4 decimals) b. Compute the standard error of the estimate using equation. SSE s = VMSE n- 2 (to 4 decimals) c. Compute the estimated standard deviation of bị using equation. (to 4 decimals) 4.
Given are tive observations for two variables, a and y. 14 18 20 55 54 42 23 15 Use the estimated regression equation: ŷ = 68.1654 – 2.4488æ. a. Compute the mean square error using equation. SSE s? = MSE = n – 2 |(to 4 decimals) b. Compute the standard error of the estimate using equation. SSE s = VMSE n- 2 (to 4 decimals) c. Compute the estimated standard deviation of bị using equation. (to 4 decimals) 4.

MATLAB: An Introduction with Applications
6th Edition
ISBN:9781119256830
Author:Amos Gilat
Publisher:Amos Gilat
Chapter1: Starting With Matlab
Section: Chapter Questions
Problem 1P

Related questions
Question
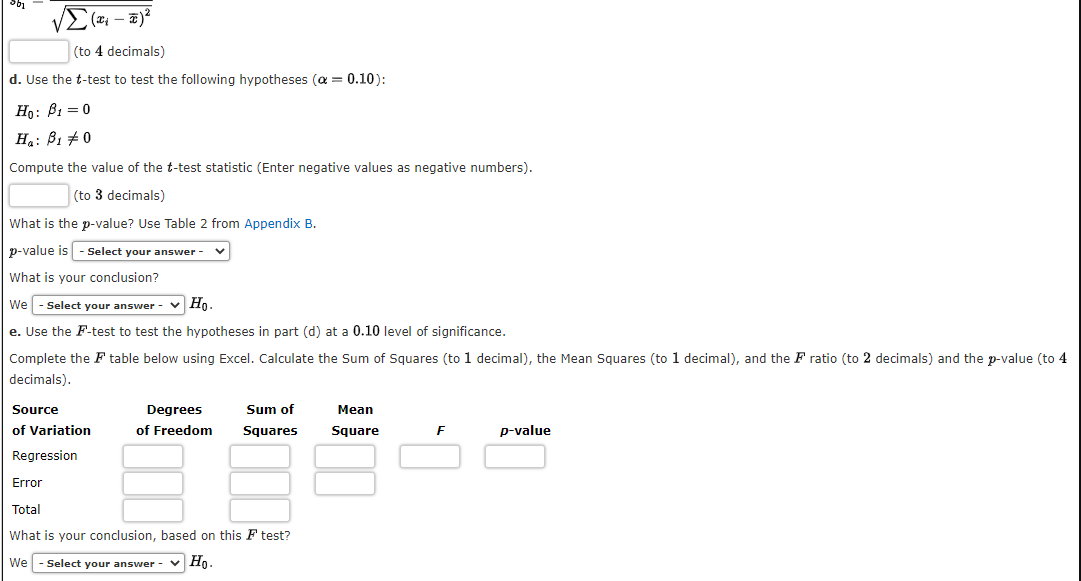
Transcribed Image Text:(to 4 decimals)
d. Use the t-test to test the following hypotheses (a = 0.10):
Ho: B1 = 0
Ha: B1 +0
Compute the value of the t-test statistic (Enter negative values as negative numbers).
(to 3 decimals)
What is the p-value? Use Table 2 from Appendix B.
p-value is - Select your answer -
What is your conclusion?
We - Select your answer - v Ho.
e. Use the F-test to test the hypotheses in part (d) at a 0.10 level of significance.
Complete the F table below using Excel. Calculate the Sum of Squares (to 1 decimal), the Mean Squares (to 1 decimal), and the F ratio (to 2 decimals) and the p-value (to 4
decimals).
Source
Degrees
Sum of
Мean
of Variation
of Freedom
Squares
Square
p-value
Regression
Error
Total
What is your conclusion, based on this F test?
We
Select your answer
v Ho.
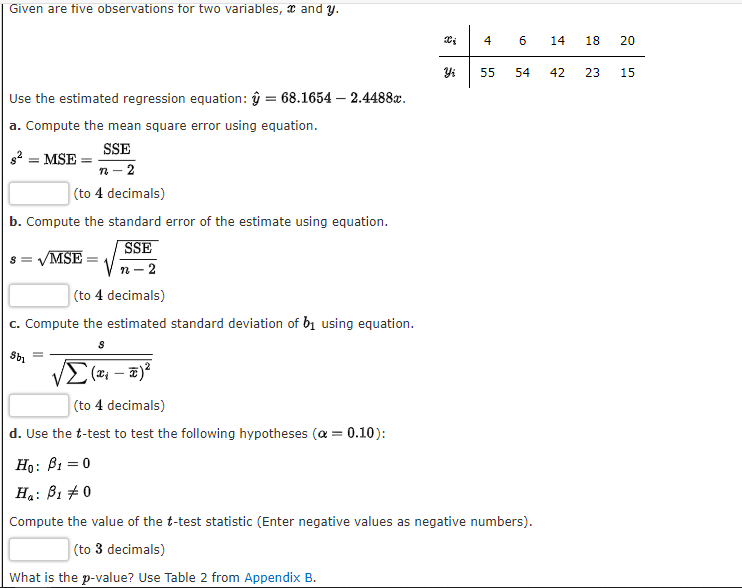
Transcribed Image Text:Given are tive observations for two variables, x and y.
14
18
20
55
54
42
23
15
Use the estimated regression equation: ŷ = 68.1654 – 2.4488x.
a. Compute the mean square error using equation.
SSE
2 = MSE :
n- 2
(to 4 decimals)
b. Compute the standard error of the estimate using equation.
SSE
/MSE
п - 2
(to 4 decimals)
c. Compute the estimated standard deviation of bị using equation.
(to 4 decimals)
d. Use the t-test to test the following hypotheses (a = 0.10):
Ho: B1 = 0
Ha: B1 +0
Compute the value of the t-test statistic (Enter negative values as negative numbers).
(to 3 decimals)
What is the p-value? Use Table 2 from Appendix B.
Expert Solution
This question has been solved!
Explore an expertly crafted, step-by-step solution for a thorough understanding of key concepts.

Step by step
Solved in 2 steps

Recommended textbooks for you
MATLAB: An Introduction with Applications
Statistics
ISBN:
9781119256830
Author:
Amos Gilat
Publisher:
John Wiley & Sons Inc

Probability and Statistics for Engineering and th…
Statistics
ISBN:
9781305251809
Author:
Jay L. Devore
Publisher:
Cengage Learning

Statistics for The Behavioral Sciences (MindTap C…
Statistics
ISBN:
9781305504912
Author:
Frederick J Gravetter, Larry B. Wallnau
Publisher:
Cengage Learning
MATLAB: An Introduction with Applications
Statistics
ISBN:
9781119256830
Author:
Amos Gilat
Publisher:
John Wiley & Sons Inc
Probability and Statistics for Engineering and th…
Statistics
ISBN:
9781305251809
Author:
Jay L. Devore
Publisher:
Cengage Learning
Statistics for The Behavioral Sciences (MindTap C…
Statistics
ISBN:
9781305504912
Author:
Frederick J Gravetter, Larry B. Wallnau
Publisher:
Cengage Learning

Elementary Statistics: Picturing the World (7th E…
Statistics
ISBN:
9780134683416
Author:
Ron Larson, Betsy Farber
Publisher:
PEARSON

The Basic Practice of Statistics
Statistics
ISBN:
9781319042578
Author:
David S. Moore, William I. Notz, Michael A. Fligner
Publisher:
W. H. Freeman

Introduction to the Practice of Statistics
Statistics
ISBN:
9781319013387
Author:
David S. Moore, George P. McCabe, Bruce A. Craig
Publisher:
W. H. Freeman