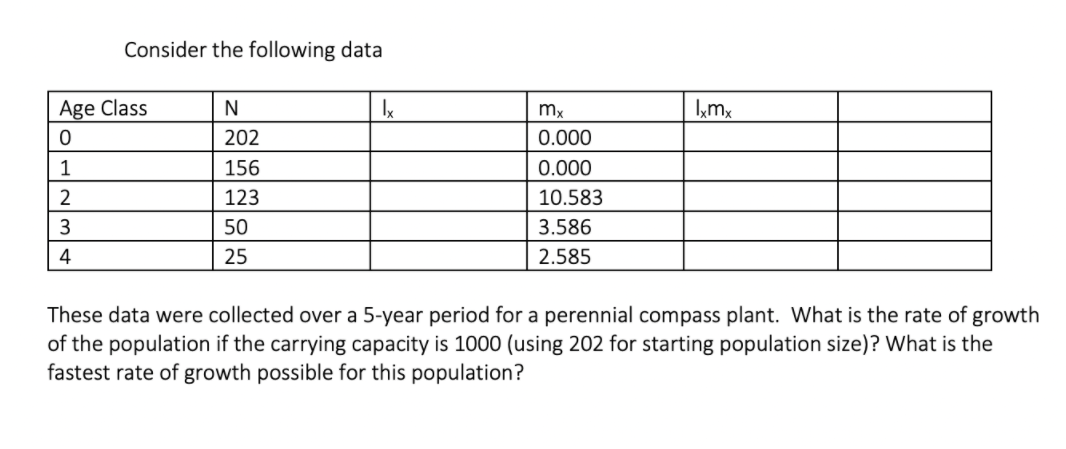
Consider the following data Age Class N 202 0.000 1 156 0.000 123 10.583 3 50 3.586 4 25 2.585 These data were collected over a 5-year period for a perennial compass plant. What is the rate of growth of the population if the carrying capacity is 1000 (using 202 for starting population size)? What is the fastest rate of growth possible for this population?


Q: The data shown in Table 1 are the average petrol consumption of sedan cars in kilometre per litre…
A: Given a data set, we have to construct stem and leaf plot of the data set.
Q: The following table gives the distribtution of weekly income of 160 families in a town : Weekly…
A: Given : n = 160
Q: Based on the following data, a forecaster used simple exponential smoothing and determined the…
A: Answer:- Option d. is the correct answer. Given, n=5
Q: 0.20 0.26 0.34 0.46 0.55 0.57 0.64 0.65 0.71 0.81 Use the accompanying radiation levels in for 50…
A:
Q: *e 51 Construct a suitable productivity index with base 1970 from the following information and also…
A:
Q: Let p(t) represent the population of a major cityt years after 1950, as shown in the table and…
A: We need to calculate the average growth rate of population from the year 1970 to 1980 We are given…
Q: The following table gives the number of pints of type A blood used at Damascus Hospital in the past…
A: Given Data : Week of Pints Used Aug 31 345 Sept 7 372 Sept 14 412 Sept 21 383 Sept 28…
Q: Compute (i) GFR, (ii) TFR, (iii) GRR from the given data. Female population in Thousands Age Number…
A:
Q: Given the following data, compute the MAD for the forecasts. Round your answer to two decimal…
A: Formula for MAD: MAD=∑Actual demand-Forecast valuen
Q: The article "Simultaneous Optimization of Mechanical Properties of Steel by Maximizing Exponential…
A: Since the p-values of the variables Carbon and Silicon are greater than 0.05. these variables are…
Q: Using an initial forecast of 22 units and an alpha of 0.25, the exponential smoothing forecast for…
A: The exponential smoothing forecast formula is, Ft=αYt-1+1-αFt-1 In the formula, α is the smoothing…
Q: Consider the following survival tables relative two survival data of a clinical trial where survival…
A: There are two survival data given. One data is for the control group with no medical device and the…
Q: Hoaglin, Mosteller, and Tukey (1983) presented data on blood levels of beta-endorphin as a function…
A: Given, Participants 12 hour before 10 hour before 1 10 6.5 2 6.5 14 3 8 13.5 4 12 18 5…
Q: 2) El-Harbawi and Babba' reported the data presented in the below table involving the toxicity of…
A:
Q: 4 Constant Laspeyre's and Paasche's index number for the following data : Commodity Base Period…
A:
Q: In a study to determine the relationship between ambient outdoor temperature and the rate of…
A: The given data is, Temperature Evaporation 11.9 2.4 21.5 4.8 16.5 5 23.6 4.1 19.1 6.2…
Q: Which of the following is correct? I. In a retrospective study, the researcher observes the process…
A: Observational study: If the researcher observes the behavior of the units in the study and provides…
Q: Considering the aggregated demand for coffee beans for the following months shown below, what would…
A: Data is given for 6 months, We have to calculate forcast for 8 th month. We will use 3 months moving…
Q: consider the following time series data.Month 1 2 3 4 5 6 7Value 24 13 20 12 19 23 15a. compute MSe…
A:
Q: Consider the table, which reflects the population, p (in millions), of a city from 1790 to 1860.…
A: Given that the table that reflects the population p of a city from 1790 to 1860. Years since 1790…
Q: Price information for selected foods for 201O and 2018 is given in the table. Quantity 2010 Price…
A: Given: Current year: 2018 Base year: 2010
Q: months are displayed. Data downloaded on 2/19/2020 from https://data.world/cityofaustin/cfer-vyii.…
A:
Q: b) When a three-month weighted moving average (W=0.5, W2 = 0.3, and W3 = 0.2) is used, what is the…
A: Data for the months January, February, March, April are given. The time series value is Yt
Q: In a biological experiment, 4 chemical concentrations are used to enhance the growth of a certain…
A: Given that, In a biological experiment, 4 chemical concentrations are used to enhance the growth of…
Q: The following table gives the number of pints of type A blood used at Damascus Hospital in the past…
A: The time series analysis conducts several forecasting techniques: (i) Moving Average (ii) Weighted…
Q: These data show the number of gallons of gasoline sold by a gasoline distributor in Bennington,…
A: The given data represents the gasoline sales. Software procedure: Step-by-step procedure to obtain…
Q: Consider the following time series data for the real consumption of households and government, at…
A: Time series defined as the depending on time. The data is arranged in a chronological order of time.…
Q: A theoretical justification based on a certain material failure mechanism underlies the assumption…
A: As per our honor code, We are allowed to answer the first three sub-parts. please repost the…
Q: Considering the aggregated demand for coffee beans for the following months shown below, what would…
A: The following information has been provided: Period (Month) Actual demand 1 455300 2 249422…
Q: x Temp (C) 0 x 15 37 100 A B C Foam Height (mm+/1 0.5mm) x D Trial 1 28.0 54.0 ? 0.0 87 85 99 Foam…
A: Here, we can simply take the average of other values at 37 oC to interpolate the value for Group 1.…
Q: The following table lists remaining life expectancy, E, in years for females of age x. x (yr) 50 60…
A: We have life expectancy E in years for females of age x. We have given Life expectancy, Eyr=33.8 for…
Q: Consider the following shipments made in the last nine months: Month Cases Shipped 1 128 137 3 135 4…
A: Ft+1= αAt+(1-α)Ft
Q: 18. From the data given below calculate the gross reproduction rate assuming that the ratio of…
A:
Q: *1. Regal Theatre puts on community theatre þroductions each season. After several years of…
A: Given that a Regal theatre puts on a community theatre productions each season , where x represents…
Q: Consider the first four entries presented in the table below, which represent one estimate of the…
A: 46. From the given information, t x 1000 0.31 1250 0.4 1500 0.5 1750 0.79 Consider,…
Q: The owner of a newsstand in a college community estimates the weekly demand for a certain magazine…
A: The formula to find the expected value is, EX=∑xPX
Q: Consider the following time series data for the real consumption of households and government, at…
A: We are given a time series data for the real consumption of household and government, at current…
Q: Consider the following time series data. Month 1 2 3 4 5 6 7 Value 22 11 18 10 17 21 13 (a) Compute…
A: The following solution is given below:
Q: The table below gives the percentage, P, of households with a VCR, as a function of year. Year 1978…
A: Given table shows the percentage P of households with VCR. We have to calculate P'1980, P'1985,…
Q: table 3 gives the actual sales, log of sales, and changes in the log of sales of Cisco Systems for…
A: Solution is given below
Q: Which of the following shock in the time series show the MA process more closely – state the reason…
A:
Q: A mutual fund achieved the following rates of growth over an 11-month period: 3% 2% 7%…
A: Given : A mutual fund achieved the following rates of growth over an 11-month period: 3% 2%…
Q: Suppose we have the following data on the number of car crashes each month for the year 2020 in the…
A: We have to test that if number accident varies seasonally or it is constant over months for that we…
Q: A study was done to look at the relationship between number of lovers college students have had in…
A: The estimated regression line is as follows:
Q: Data collected on the yearly demand for 50-pound bags of fertilizer at Wallace Garden Supply are…
A:
Q: Let pt) represent the population of a major city t years after 1950, as shown in the table and…
A: Use average rate formula to evaluate it
Q: The following data represents the growth of a bacteria population over time. Hours 1 12 Bacteria 600…
A:
Q: Use the figure below to answer these questions. Global Average Temperature 1.0 0.8 Annual mean…
A: Given : A graph showing Temperature vs Baseline on y-axis and 30 year timeline on y-axis.
Q: Given the following two models, log C = ß1 + BzlogGD; + û¡ and logG = B1 + BzlogGl; + û use…
A:


Trending now
This is a popular solution!

Step by step
Solved in 2 steps with 3 images

- Table 6 shows the population, in thousands, of harbor seals in the Wadden Sea over the years 1997 to 2012. a. Let x represent time in years starting with x=0 for the year 1997. Let y represent the number of seals in thousands. Use logistic regression to fit a model to these data. b. Use the model to predict the seal population for the year 2020. c. To the nearest whole number, what is the limiting value of this model?The operator of a pumping station has observed that demand for water during early afternoon hours has an approximately exponential distribution with mean 1000 cfs (cubic feet per second). a)Of the three randomly selected afternoons, what is the probability that on at least two afternoons the demand will exceed 700 cfs?Much concern has been expressed regarding the practice of using nitrates as meat preservatives. In one study involving possible effects of these chemicals, bacteria cultures were grown in a medium containing nitrates. The rate of uptake of radio-labeled amino acid (in dpm, disintegrations per minute) was then determined for each culture, yielding the following observations. 7,255 6,875 9,637 6,863 9,098 5,846 8,954 7,979 7,068 7,498 7,882 8,179 7,528 8,728 7,469 Suppose that it is known that the mean rate of uptake for cultures without nitrates is 8,000. Do the data suggest that the addition of nitrates results in a decrease in the mean rate of uptake? Test the appropriate hypotheses using a significance level of 0.10. Find the test statistic and P-value. (Use technology to calculate the P-value. Round your test statistic to two decimal places and your P-value to three decimal places.) t= P-value= State your conclusion. Reject H0. We have convincing evidence that the mean rate of…
- Compute the forecasted values for Yt for July and August in 2020 by using the modelsstated in (c) and (d)Recent publications have addressed the growing concern in the scientific community around the increased prevalence of CAT scans in children between the ages of 7-18 and the growing rate of childhood cancers. Suppose the researcher plans to gather a SRS from a group of children in this age range who have received one or more CAT scans, and a SRS from a group of children who have never received a CAT scan and compare the number of cases of childhood cancers that develop over a prolonged period of time. Assume the following table summarizes the descriptive statistics for his samples. Population Average cases of childhood cancers Standard deviaton Sample size >CAT scan 24.6 2.4 1,894 No CAT scans 11.4 1.9 2,745 A) Carry out the appropriate statistical test to answer the researcher’s hypothesis regarding the difference in average cases of childhood cancers in children aged 7-18 receiving one or more CAT scans versus those that have never received a CAT scan. Use an alpha level…The following table gives the number of pints of type A blood used at Damascus Hospital in the past 6 weeks: Week Of Pints UsedAugust 31 360September 7 389September 14 410September 21 378September 28 368October 5 374 a) The forecasted demand for the week of October 12 using a 3-week moving average = 373.33 pints (round your response to two decimal places). b) Using a 3-week weighted moving average, with weights of 0.15, 0.25, and 0.60, using 0.60 for the most recent week, the forecasted demand for the week of October 12 = ? pints (round your response to two decimal places and remember to use the weights in appropriate order — the largest weight applies to most recent period and smallest weight applies to oldest period.)
- A manufacturer claims that the tensile strength of a certain composite (in MPa) has the lognormal distribution with μ = 5 and σ = 0.5. Let X be the strength of a randomly sampled specimen of this composite. a) If the claim is true, what is P(X < 20)? b) Based on the answer to part (a), if the claim is true, would a strength of 20 MPa be unusually small? c) If you observed a tensile strength of 20 MPa, would this be convincing evidence that the claim is false? Explain. d) If the claim is true, what is P(X < 130)? e) Based on the answer to part (d), if the claim is true, would a strength of 130 MPa be unusually small? f) If you observed a tensile strength of 130 MPa, would this be convincing evidence that the claim is false? Explain.Researchers interested in lead exposure due to car exhaust sampled the blood of 52 police officers subjected to constant inhalation of automobile exhaust fumes while working traffic enforcement in a primarily urban environment. The blood samples of these officers had an average lead concentration of 124.32 µg/l and a SD of 37.74 µg/l; a previous study of individuals from a nearby suburb, with no history of exposure, found an average blood level concentration of 35 µg/l. Based on your preceding result, without performing a calculation, would a 99% confidence interval for the average blood concentration level of police officers contain 35 µg/l? Based on your preceding result, without performing a calculation, would a 99% confidence interval for this difference contain 0? Explain why or why not.Since the Cobot’s gripper is a critical component, a reliability of 99% is desired for that component. The failure time, in hours, of the cobot’s gripper follows a lognormal distribution with µt=10.52 and σt= 1.44. the gripper is considered a consumable item (i.e., if failed, the gripper is replaced, not repaired. a. What is the MTTF? b. At what number of hours of use should the gripper be replaced to meet the desired 99% reliability?
- Find the forecast for the month of May using the exponential smoothing methodDemand dataJan 32.1 Feb 36.2 Mar 28.0 Apr 27.5And the January Forecast was: 27Smoothing constant = 0.15b) Find the mean absolute deviation (MAD) if the actual demand for May is 30.0The operator of a pumping station has observed that demand for water during early afternoon hours has an approximately exponential distribution with mean 100 cfs (cubic feet per second).a) Find the probability that the demand will exceed 200 cfs during the early afternoon on arandomly selected day.b) What water-pumping capacity should the station maintain during early afternoons sothat the probability that demand will exceed capacity on a randomly selected day isonly .01?For the situation described below, state the null and alternative hypotheses to be tested. (Enter != for ≠ as needed.) A new variety of pearl millet is expected to provide an increased yield over the variety presently in use, which has a mean yield of about 55 bushels per acre.
