x Temp (C) 0 x 15 37 100 A B C Foam Height (mm+/1 0.5mm) x D Trial 1 28.0 54.0 ? 0.0 87 85 99 Foam Height (mm+/1 0.5mm) 110 Trial 2 26.0 53.0 97.0 0.5 Foam Height (mm+/1 0.5mm) Trial 3 30.5 53.5 98.5 0.5 Foam Height (mm+/1 0.5mm) Trial 4 27.5 
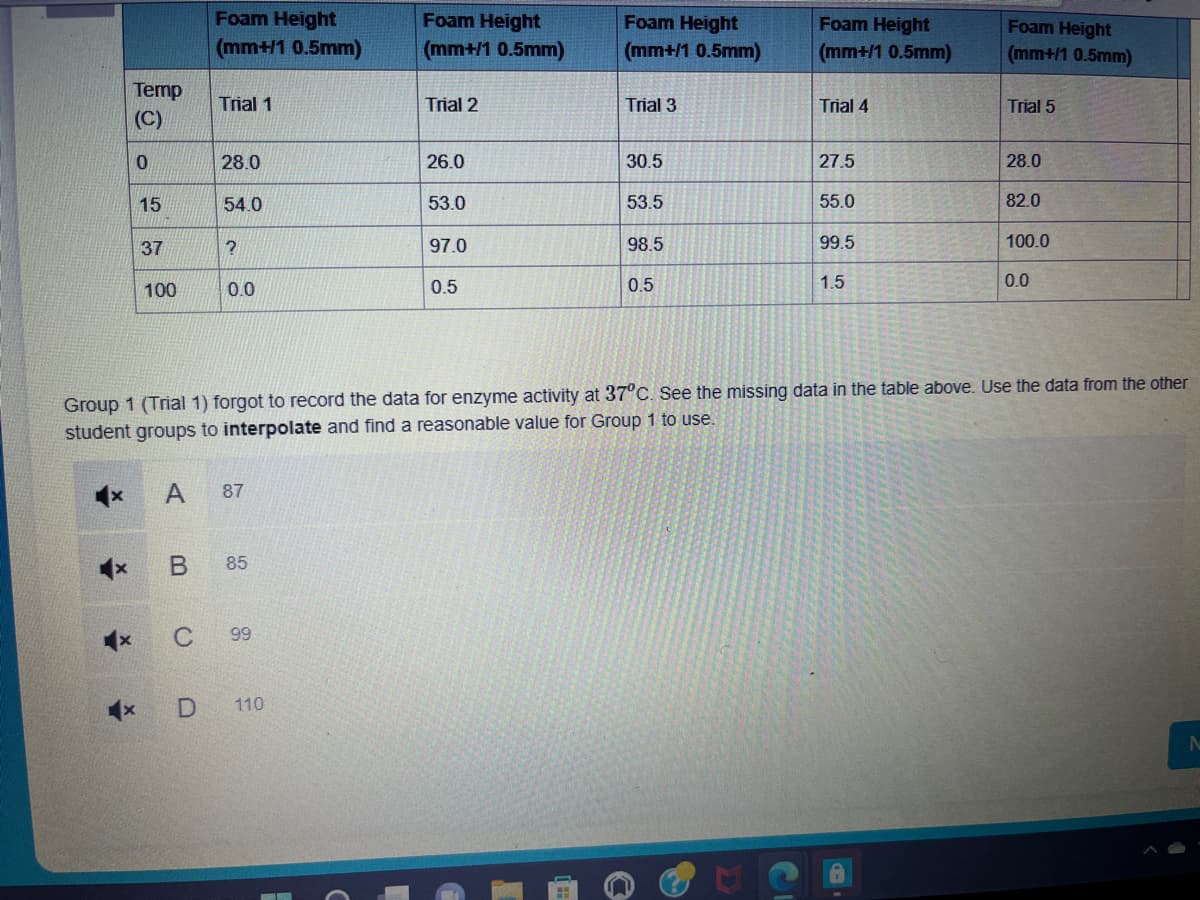
Group 1 (Trial 1) forgot to record the data for enzyme activity at 37°C. See the missing data in the table above. Use the data from the other student groups to interpolate and find a reasonable value for Group 1 to use. 55.0 99.5 1.5 Foam Height (mm+/1 0.5mm) Trial 5 28.0 82.0 100.0 0.0
Q: The Medical Rehabilitation Education Foundation reports that the average cost of rehabilitation for…
A: It is given that Sample size n = 35 Sample mean = 26343 Population SD = 3251 Level of significance =…
Q: The following are the ages of 13 physics teachers in a school district. 24, 28, 29, 41, 41, 43,…
A: Lower quartile(Q1)=(n+1)4th termUpper quartile(Q3)=3(n+1)4th termSample size(n)=13and the given data…
Q: lculating the confidence interval.
A: x Freq 1 3 2 5 3 19 4 7 5 6 Total 40
Q: Province School index 1 2 3 4 5 957 6 4 6 7 8 9 7 8 House prices y 210 185 190 190 170 195 180 195…
A: Note: As per the guidelines of Bartleby, we have to solve only the first four parts. So, I have…
Q: if Group A was only tested in the morning and Group B was only tested in the afternoon, this would…
A: Since multiple questions are presented, we will only answer the first question. The answer to the…
Q: A professor has recorded exam grades for 40 students in his class, but one of the grades is no…
A: From the provided information, Number of students = 40 The score on the exam was 82. The mean of the…
Q: Population wealth as categorized by socioeconomic status classes (low, medium, high SES) is best…
A: Defination Ordinal data: Nominal data measures qualitative data but it measure in ordered.
Q: etermine the skewness if the data given is a sample.
A: The given table is Lower Class Limit Upper Class limit Frequency 0 2 2 3 5 5 6 8 3 9 11…
Q: m для домей одначей ці мен ней до 3 грно, это f(xy) = x + (y)in + x = 0, yo You have to find the…
A: As per bartleby guidelines we can solve only first question and rest can be reposted
Q: Asset X pays 2 if state 1 occurs and 4 if state 2 occurs and costs 3. Asset Y pays 3 if state 1…
A: GivenAsset X pay 2 if state 1 occur.Asset X pay 4 if state 2 occur. Asset Y pay 3 if state 1…
Q: Create the graphical summary. Write a sentence that describes the data.
A: Given: The data is given as 19 86 27 42 11 12 13 5 27 20 83 4 69 10…
Q: a. Construct a stem-and-leaf display based on repeat- ing each stem value twice, and comment on…
A: From give date we have sample : 16 18 18 26 33 41 54 56 66 68 87 91 95 98 106 109 111 118 127 127…
Q: (A) Variance relates to how the values in the data set are positioned relative to each other. (B) A…
A: Variance is the measure of dispersion. It measure the squared difference of each observation from…
Q: A sample of 200 people has a mean age of 21 with a population standard deviation (σ) of 5. Test the…
A: Given: Sample size(n)=200Sample mean(x¯)=21Population mean(μ)=18.9Population Standard deviation(σ)=5
Q: Gender Self-taught Studied in School Private Instruction Total Female 18 38 25 81 Male 11 27 11 49…
A: From the provided information, Gender Self-taught Studied in School Private Instruction…
Q: The graph to the right gives the percent of persons 25 years and over who have completed four or…
A: First we will write down data from histogram We will calculate regression equation by least square…
Q: According to the Vivino website, suppose the mean price for a bottle of red wine that scores 4.0 or…
A: Given: Population mean μ = $32.48 Sample size n = 59 Sample mean X = $30.15 Sample standard…
Q: When using 1-Var Stats on a scientific or graphing calculator, the resulting statistical output…
A: Introduction: It is required to discuss about the difference between the two different types of…
Q: 3. (Refer to Krejcie and Morgan Table) Considering the 1, 200 students in the School of Teacher…
A: Given information: Method to be used: Krejcie & Morgan sample size determination method…
Q: A defunct website listed the "average" annual income for Florida as $35,031. What is the role of…
A: Descriptive Statistics: The assessment, summation, and findings of the research pertaining to…
Q: n psychology students took a standardized test. The scores are summarized in the GFDT below. Scores…
A: Introduction In the given scenario, the data showed the table with the scores of students. The…
Q: Q 2 D please
A: Quantitative variable are numerical variable. It mostly used the single variable to make descriptive…
Q: Risk management and insurance
A: Given data: X Losses, f 0 300 1 400 2 300 3 300 4 100 5 150 6 200 7 200 8 300…
Q: Construct a relative frequency distribution of the data.
A: Given: Response Frequency, f Las Vegas 1268 Orlando 814 New York 1148 Chicago 539 San…
Q: The accompanying data set lists diastolic blood pressure measurements (mm Hg) of females. All of the…
A:
Q: Consider the bar graph, which shows the numbers and percentages of bachelor's degrees in engineering…
A: The objective is to determine the ratio of the number of men to the number of women earning…
Q: Business has been good! As a result, Benjamin has a total of $25,000 in bonus pay to distribute…
A: Given: The total bonus amount is $25000 After distribution each employee will get $2500
Q: Find the area under the standard normal distribution curve.
A: Hello! As you have posted more than 3 sub parts, we are answering the first 3 sub-parts. In case…
Q: An efficacy study was conducted for the drug pamidronate in patients with stage III multiple myeloma…
A: Odd ratio measure the odd's of disease exposed to the case and control. It is calculated using the…
Q: write a question including population and collect the data from this porpulation using stratified…
A: Sampling is the technique used to take sample from the population. It allow equal chance to all the…
Q: 3. (Refer to Krejcie and Morgan Table) Considering the 1, 200 students in the School of Teacher…
A: Sample is the subset of population. Sampling is the method used to take sample from the population.…
Q: If 500 consumers were surveyed, give the frequency distribution for these data
A: b): if N=500 consumers were surveyed then frequency distribution of the data will be ?
Q: As an electrical engineer, you have designed a new efficient light bulb. In order to predict its…
A: Formula Used: Mean X = ∑FX∑F Standard deviation = ∑FX2-nX2∑F-1
Q: A community college employs 87 full-time faculty members. To gain the faculty's opinions about an…
A: Given Information: A community college employs 87 full-time faculty members. They are numbered from…
Q: The U.S. Geological Survey compiled historical data about Old Faithful Geyser (Yellowstone National…
A:
Q: Class Problem Estimate the coefficients for the model y₁ = bo + b₁x₁ + εi. x² 1 9 25 b₁ x иышн 1 3 5…
A:
Q: Calculate the error bound for the mean and construct the 95% confidence interval, showing all work…
A: Error bound of the mean is also known as margin of error. It is calculated by the combined value of…
Q: The lifetimes (in units of 10³ seconds) of a sample of electronic com- ponents tested to destruction…
A: Data is given for Groups and frequencies First we will calculate frequency table by calculating mid…
Q: "A look at the descriptive statistics for males and females show that male scores generally fall…
A: The statement that is WITHOUT DOUBT correct is ' the variance for females is larger than the…
Q: The time required to assemble a part of a machine follows an exponential probability distribution.…
A: given data X follows exponential distribution x = assembly time μ = 7 minutes∴λ = 17 per minute
Q: A frequency table of grades has five classes (A, B, C, D, F) with frequencies of 3, 11, 16, 7, and 1…
A: Formula Used: Relative frequency = Fn Where, F is the frequency and n is the sum of frequency.
Q: A Municipal Survey on the drinking habits of South Africans estimated the percentage of youth across…
A: Since you have posted a question with multiple sub-parts, we will solve first three subparts for…
Q: Identify what's wrong. Twelve nutritionists are each paid $100,000 to try new celebrity diet on ten…
A: Since you have posted multiple question I can answer only first question for you. Given: Twelve…
Q: 12. The average waiting time to be seated for dinner at a popular restaurant is 23.5 minutes, with a…
A: 12) Given Information: Mean μ=23.5 Standard deviation σ=3.6
Q: When playing games of chance like roulette, people often say that a particular outcome is due,…
A: Given: In games like roulette, people often say that a particular outcome is "due" meaning that one…
Q: The results of a sample of 7 data points are presented below in terms of the Average Daily…
A: Given data: Average daily temperature (x) Average monthly precipitation (y) 86 3.4 81 1.8…
Q: (A) Variance relates to how the values in the data set are positioned relative to each other. (B) A…
A: There are two type of measures, one is measure of central tendency and and other is measures of…
Q: Accurate prediction of the timing of death in patients with a terminal illness is important for…
A: Given that,
Q: Consider the following ordered data. 4 7 7 8 9 9 10 11 12 (a) Find the low, Q1,…
A:
Q: Compute the range and sample standard deviation for strength of the concrete (in psi). 3940,…
A: Given data is 3940,4100,3300,3100,2920,3870,4100,4060sample size(n)=8
Trending now
This is a popular solution!
Step by step
Solved in 2 steps
- Find three positive geometric means between 2 and 8The Old Farmer’s Almanac stated that the average consumption of water per person per day was 123 gallons. To test the hypothesis that this figure may no longer be true, a researcher randomly selected 16 people and found that they used on average 119 gallons per day and s = 5.3. At α = 0.05, is there enough evidence to say that the Old Farmer’s Almanac figure might no longer be correct? Use the P-value method.What’s the Z0 and Pvalue ?
- What is the z0 and Pvalue ?A polling organization has been hired to conduct a survey to determine the proportion of people who are likely to support an upcoming ballot initiative. To help determine the size of the sample required for the main poll, a preliminary poll of 20 people is taken that yields the results below. (Yes indicates that the person will support the initiative, No indicates that they won't.) YesYesNoNoNoYesYesYesYesYesYesNoNoYesYesNoYesYesNoNoYesNoYesNoYesYesYesYesYesYesNoYesYesYesNoNoYesNoNoNo Based on the results of the peliminary poll, how large a sample is required for the main poll, assuming that the main poll should have a margin of error of 3% and a confidence level of 97.8%. Sample Size =Please Solve Subdivision d),e) and f) onlyA salesperson goes door-to-door in a residential area to demonstrate the useof a new household appliance to potential customers. At the end of a demonstration,the probability that the potential customer would place an order for the product is aconstant 0.2107. To perform satisfactorily on the job, the salesperson needs at leastfour orders. Assume that each demonstration is a Bernoulli trial. a) If the salesperson makes 15 demonstrations, what is the probability thatthere would be exactly 4 orders? b) If the salesperson makes 16 demonstrations, what is the probability thatthere would be at most 4 orders? c) If the salesperson makes 17 demonstrations, what is the probability thatthere would be at least 4 orders? d) If the salesperson makes 18 demonstrations, what is the probability thatthere would be anywhere from 4 to 8 (both inclusive) orders? e) If the salesperson wants to be at least 90% confident of getting at least4 orders, at least how…
- A medical researcher says that less than 86% of adults in a certain country think that healthy children should be required to be vaccinated. In a random sample of 300 adults in that country, 84% think that healthy children should be required to be vaccinated. At α=0.05, is there enough evidence to support the researcher's claim? Complete parts (a) through (e) below. (a) Identify the claim and state H0 and Ha. Identify the claim in this scenario. Select the correct choice below and fill in the answer box to complete your choice. (Type an integer or a decimal. Do not round.) A. Less than 8686% of adults in the country think that healthy children should be required to be vaccinated. B. The percentage of adults in the country who think that healthy children should be required to be vaccinated is not nothing%. C. nothing% of adults in the country think that healthy children should be required to be vaccinated. D. More than nothing%…A medical researcher says that less than 74%of adults in a certain country think that healthy children should be required to be vaccinated. In a random sample of 600adults in that country, 71% think that healthy children should be required to be vaccinated. At α=0.01, is there enough evidence to support the researcher's claim? Complete parts (a) through (e) below. (a) Identify the claim and state H0 andHa. Identify the claim in this scenario. Select the correct choice below and fill in the answer box to complete your choice. (Type an integer or a decimal. Do not round.) Fill the percentage on the correct answer A. % of adults in the country think that healthy children should be required to be vaccinated. B. Less than %of adults in the country think that healthy children should be required to be vaccinated. C. The percentage of adults in the country who think that healthy children should be required to be vaccinated is not %. D. More than…An MSCR project student group sought to investigate whether diabetes-related emergency department (ED) visits, following the implementation of the affordable care act, increased. The group decided to do a power calculation to determine the minimum difference in the proportion of diabetes-related ED visits before and after the implementation of the affordable care act they could detect and found the power to be 0.87. State the null and alternative hypotheses on which the power calculation is based and briefly explain what the power of 0.87 they computed means.
- A city official claims that the proportion of all commuters who are in favor of an expanded public transportation system is 50%. A newspaper conducts a survey to determine whether this proportion is different from 50%. Out of 225 randomly chosen commuters, the survey finds that 99 of them reply yes when asked if they support an expanded public transportation system. Test the official’s claim at α= 0.05.A medical researcher says that less than 85% of adults in a certain country think that healthy children should be required to be vaccinated. In a random sample of 300 adults in that country, 83% think that healthy children should be required to be vaccinated. At α=0.01, is there enough evidence to support the researcher's claim? Complete parts (a) through (e) below. (a) Identify the claim and state H0 and Ha. Identify the claim in this scenario. Select the correct choice below and fill in the answer box to complete your choice. (Type an integer or a decimal. Do not round.) A. Less than enter your response here% of adults in the country think that healthy children should be required to be vaccinated. B. The percentage of adults in the country who think that healthy children should be required to be vaccinated is not enter your response here%. C. More than enter your response here% of adults in the country think that healthy children…A medical researcher says that less than 76% of adults in a certain country think that healthy children should be required to be vaccinated. In a random sample of 500 adults in that country, 73% think that healthy children should be required to be vaccinated. At α=0.01, is there enough evidence to support the researcher's claim? Complete parts (a) through (e) below. (a) Identify the claim and state H0 and Ha. Identify the claim in this scenario. Select the correct choice below and fill in the answer box to complete your choice. (Type an integer or a decimal. Do not round.) A. The percentage of adults in the country who think that healthy children should be required to be vaccinated is not nothing%. B. Less than 7676% of adults in the country think that healthy children should be required to be vaccinated. Your answer is correct. C. nothing% of adults in the country think that healthy children should be required to be vaccinated. D. More…