Consider the following data for a dependent variable y and two independent variables, x1 and x2. x1 x2 30 13 95 47 11 108 25 17 112 51 16 179 41 95 52 20 175 74 7 171 36 13 118 60 14 142 77 17 211 The estimated regression equation for these data is ŷ = -12.88 + 1.96x1 + 4.27x2 Here SST = 15,090.4, SSR = 13,501.7, 8b. 0.2893, and sb2 1.0822. %3D a. Test for a significant relationship among a1, x2, and y. Use a = .05. Compute F-test statistic (to 2 decimals). Use F table. The p-value is - Select your answer - What is your conclusion? - Select your answer - b. Compute the t test statistic for the significance of B1. Use a = .05 (to 2 decimals). Use t table. Thep-value is - Select your answer - ♥ What is your conclusion? B1 - Select your answer - v significant. c. Compute the t test statistic for the significance of B2. Use a = .05 (to 2 decimals). Uset table. The p-value is - Select your answer - What is your conclusion? B2|- Select your answer - ♥ significant.
Consider the following data for a dependent variable y and two independent variables, x1 and x2. x1 x2 30 13 95 47 11 108 25 17 112 51 16 179 41 95 52 20 175 74 7 171 36 13 118 60 14 142 77 17 211 The estimated regression equation for these data is ŷ = -12.88 + 1.96x1 + 4.27x2 Here SST = 15,090.4, SSR = 13,501.7, 8b. 0.2893, and sb2 1.0822. %3D a. Test for a significant relationship among a1, x2, and y. Use a = .05. Compute F-test statistic (to 2 decimals). Use F table. The p-value is - Select your answer - What is your conclusion? - Select your answer - b. Compute the t test statistic for the significance of B1. Use a = .05 (to 2 decimals). Use t table. Thep-value is - Select your answer - ♥ What is your conclusion? B1 - Select your answer - v significant. c. Compute the t test statistic for the significance of B2. Use a = .05 (to 2 decimals). Uset table. The p-value is - Select your answer - What is your conclusion? B2|- Select your answer - ♥ significant.

MATLAB: An Introduction with Applications
6th Edition
ISBN:9781119256830
Author:Amos Gilat
Publisher:Amos Gilat
Chapter1: Starting With Matlab
Section: Chapter Questions
Problem 1P

Related questions

Topic Video
Question
I need help answering this question.
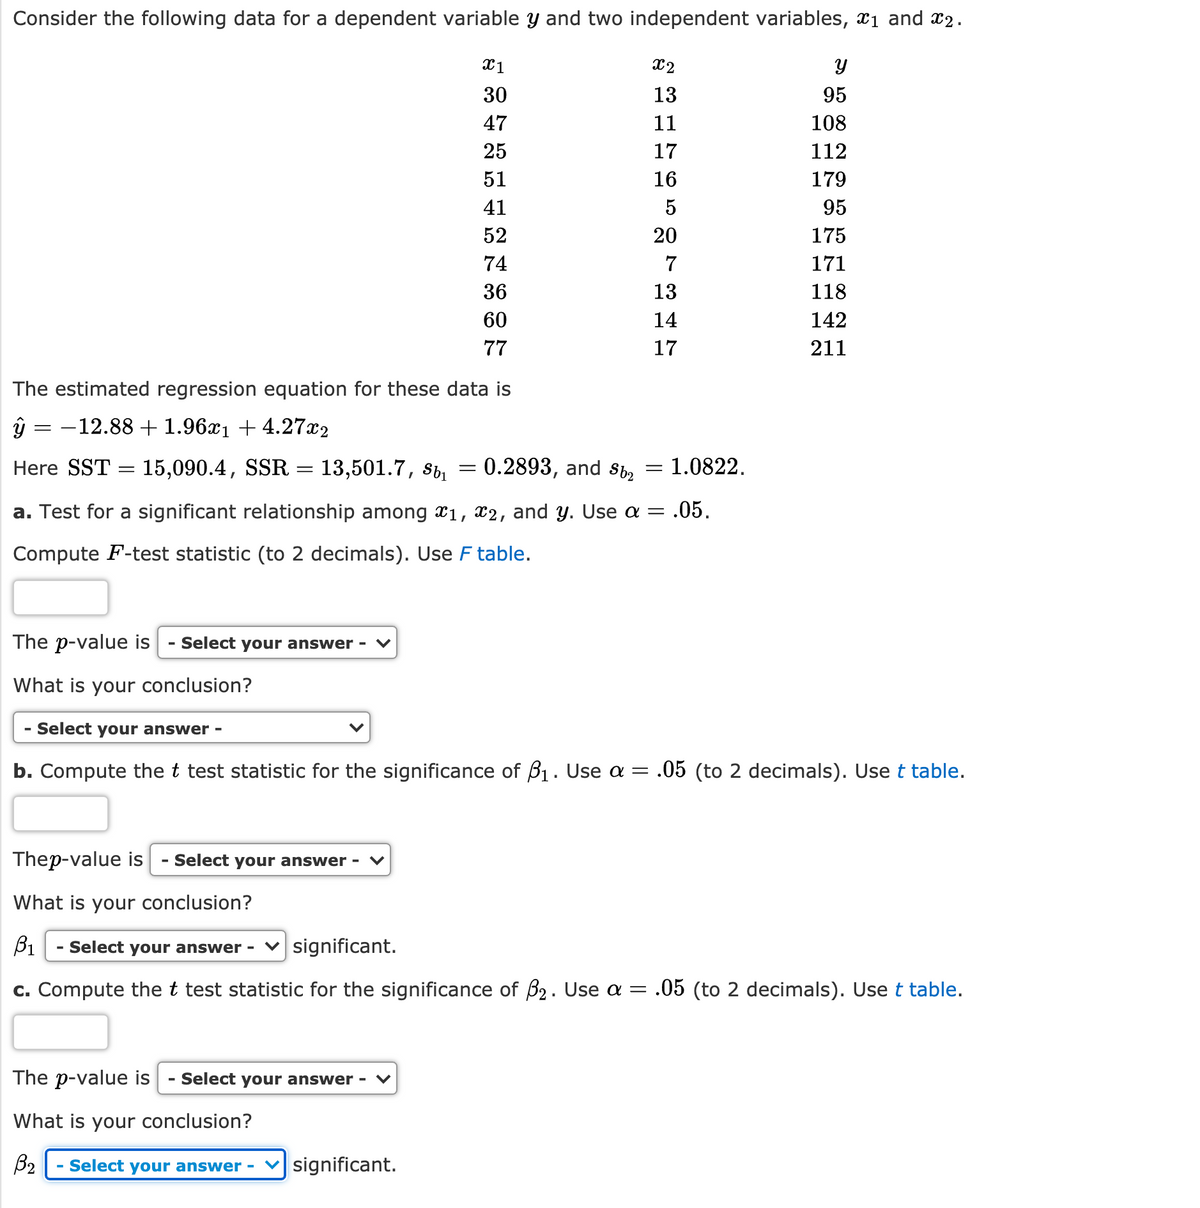
Transcribed Image Text:Consider the following data for a dependent variable y and two independent variables, x1 and x2.
X2
30
13
95
47
11
108
25
17
112
51
16
179
41
5
95
52
20
175
74
171
36
13
118
60
14
142
77
17
211
The estimated regression equation for these data is
-12.88 + 1.96x1 + 4.27x2
Here SST
15,090.4,
SSR
13,501.7, Sb,
= 0.2893, and Sb2
= 1.0822.
a. Test for a significant relationship among x1, x2, and y. Use a = .05.
Compute F-test statistic (to 2 decimals). Use F table.
The p-value is
Select your answer -
What is your conclusion?
Select your answer -
b. Compute the t test statistic for the significance of B1. Use a = .05 (to 2 decimals). Use t table.
Thep-value is
Select your answer - ▼
What is your conclusion?
B1
Select your answer -
v significant.
c. Compute the t test statistic for the significance of B2. Use a = .05 (to 2 decimals). Use t table.
The p-value is
Select your answer -
What is your conclusion?
B2
Select your answer -
v significant.
Expert Solution
This question has been solved!
Explore an expertly crafted, step-by-step solution for a thorough understanding of key concepts.

Step by step
Solved in 6 steps

Knowledge Booster


Learn more about
Need a deep-dive on the concept behind this application? Look no further. Learn more about this topic, statistics and related others by exploring similar questions and additional content below.Recommended textbooks for you
MATLAB: An Introduction with Applications
Statistics
ISBN:
9781119256830
Author:
Amos Gilat
Publisher:
John Wiley & Sons Inc

Probability and Statistics for Engineering and th…
Statistics
ISBN:
9781305251809
Author:
Jay L. Devore
Publisher:
Cengage Learning

Statistics for The Behavioral Sciences (MindTap C…
Statistics
ISBN:
9781305504912
Author:
Frederick J Gravetter, Larry B. Wallnau
Publisher:
Cengage Learning
MATLAB: An Introduction with Applications
Statistics
ISBN:
9781119256830
Author:
Amos Gilat
Publisher:
John Wiley & Sons Inc
Probability and Statistics for Engineering and th…
Statistics
ISBN:
9781305251809
Author:
Jay L. Devore
Publisher:
Cengage Learning
Statistics for The Behavioral Sciences (MindTap C…
Statistics
ISBN:
9781305504912
Author:
Frederick J Gravetter, Larry B. Wallnau
Publisher:
Cengage Learning

Elementary Statistics: Picturing the World (7th E…
Statistics
ISBN:
9780134683416
Author:
Ron Larson, Betsy Farber
Publisher:
PEARSON

The Basic Practice of Statistics
Statistics
ISBN:
9781319042578
Author:
David S. Moore, William I. Notz, Michael A. Fligner
Publisher:
W. H. Freeman

Introduction to the Practice of Statistics
Statistics
ISBN:
9781319013387
Author:
David S. Moore, George P. McCabe, Bruce A. Craig
Publisher:
W. H. Freeman