Consider the following incomplete grouped frequency distribution. Classes (Rand) Frequency Cumulative frequency 24 8.00 < 12.00 24 12.00 < 16.00 16.00 < 20.00 Y 46 102 20.00 < 24.00 18 120 ТОTALS 120 The values of X and Y, respectively, are Select one: A. 40 and 20 B. 22 and 58 C. 32 and 56 D. 56 and 32
Consider the following incomplete grouped frequency distribution. Classes (Rand) Frequency Cumulative frequency 24 8.00 < 12.00 24 12.00 < 16.00 16.00 < 20.00 Y 46 102 20.00 < 24.00 18 120 ТОTALS 120 The values of X and Y, respectively, are Select one: A. 40 and 20 B. 22 and 58 C. 32 and 56 D. 56 and 32

Algebra & Trigonometry with Analytic Geometry
13th Edition
ISBN:9781133382119
Author:Swokowski
Publisher:Swokowski
Chapter11: Topics From Analytic Geometry
Section11.4: Plane Curves And Parametric Equations
Problem 44E

Related questions
Question
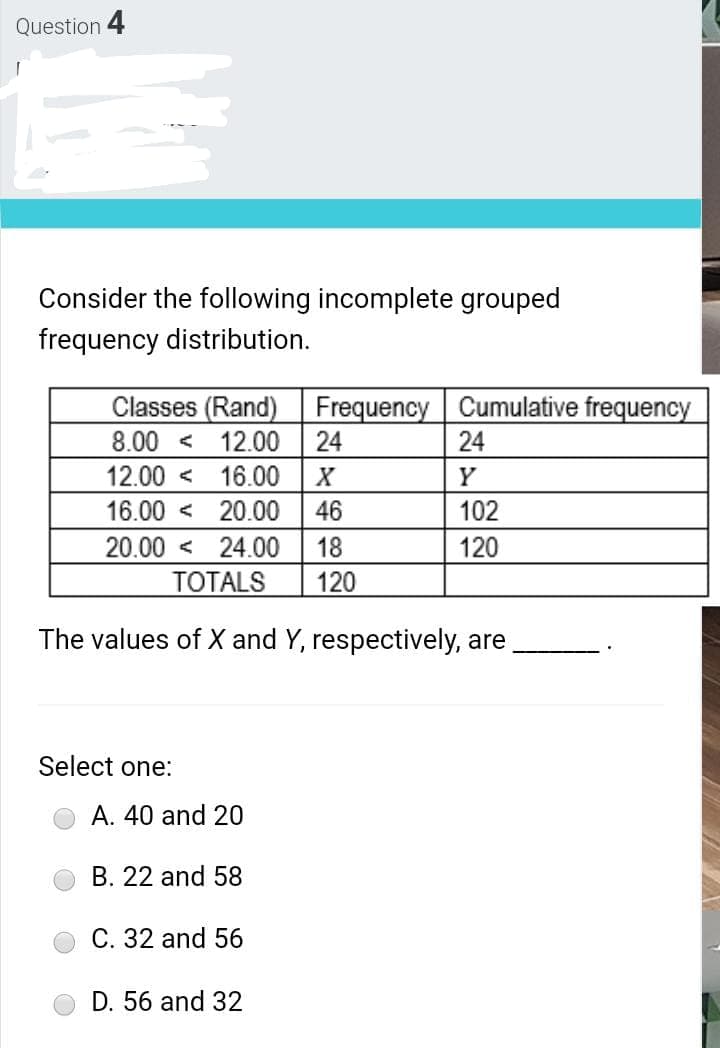
Transcribed Image Text:Question 4
Consider the following incomplete grouped
frequency distribution.
Classes (Rand)
8.00 < 12.00
Frequency Cumulative frequency
24
24
12.00 < 16.00
Y
16.00 < 20.00
46
102
20.00 < 24.00
ТОTALS
18
120
120
The values of X and Y, respectively, are
Select one:
A. 40 and 20
B. 22 and 58
C. 32 and 56
D. 56 and 32
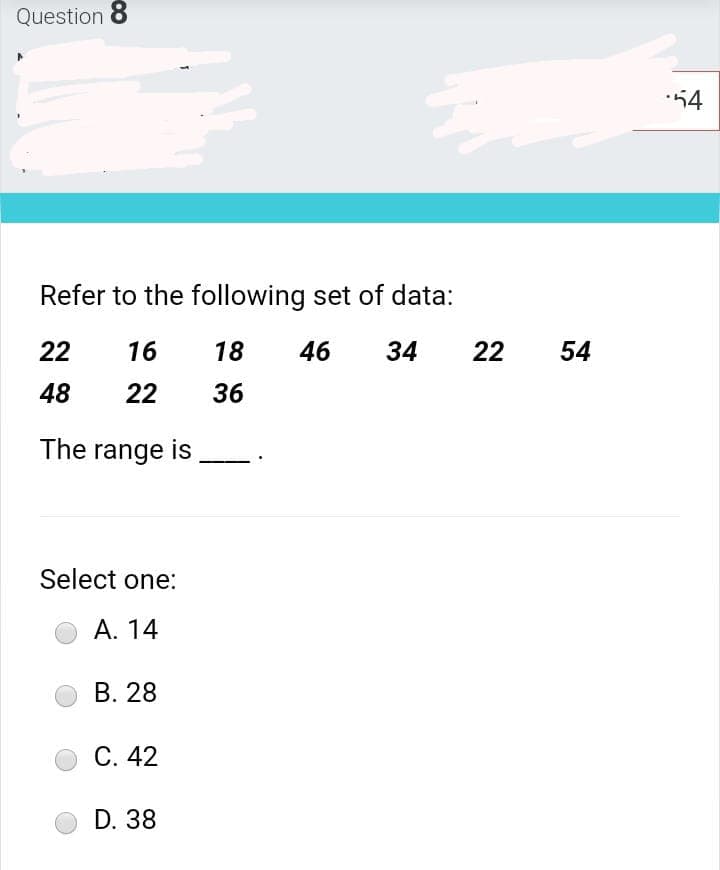
Transcribed Image Text:Question 8
54
Refer to the following set of data:
22
16
18
46
34
22
54
48
22
36
The range is
Select one:
А. 14
В. 28
С. 42
D. 38
Expert Solution
This question has been solved!
Explore an expertly crafted, step-by-step solution for a thorough understanding of key concepts.

This is a popular solution!

Trending now
This is a popular solution!

Step by step
Solved in 3 steps with 3 images

Knowledge Booster


Learn more about
Need a deep-dive on the concept behind this application? Look no further. Learn more about this topic, statistics and related others by exploring similar questions and additional content below.Recommended textbooks for you
Algebra & Trigonometry with Analytic Geometry
Algebra
ISBN:
9781133382119
Author:
Swokowski
Publisher:
Cengage

Trigonometry (MindTap Course List)
Trigonometry
ISBN:
9781337278461
Author:
Ron Larson
Publisher:
Cengage Learning
Algebra & Trigonometry with Analytic Geometry
Algebra
ISBN:
9781133382119
Author:
Swokowski
Publisher:
Cengage
Trigonometry (MindTap Course List)
Trigonometry
ISBN:
9781337278461
Author:
Ron Larson
Publisher:
Cengage Learning