Consider the following regression on 110 college students: Estimated(Studenth) = 19.6 + 0.73(Midparh) , R = 0.45, SER = 2.0 Standard errors are as hereunder: SE(intercept) = (7.2) SE(Midparh) = (0.10) (Values in parentheses are heteroskedasticity-robust standard errors). where "Studenth" is the height of students in inches, and "Midparh" is the average of the parental heights. (a) Using a t-test approach and 5% level of significance, test if slope coefficient can be positive. Make sure you write both hypothesis claims properly. (b) If children, on average, were expected to be of the same height as their parents, then this would imply that the coefficient of intercept becomes zero and the coefficient of slope will be 1: (i) Test if the coefficient of intercept is zero at 1% level of significance. Test if the slope coefficient is 1 at 5% level of significance. (Note: the statistical table is attached hereto) (c) Repeat part (B)-(i) using the p-value approach. (d) Repeat part (B)-(ii) using the p-value approach.
Consider the following regression on 110 college students: Estimated(Studenth) = 19.6 + 0.73(Midparh) , R = 0.45, SER = 2.0 Standard errors are as hereunder: SE(intercept) = (7.2) SE(Midparh) = (0.10) (Values in parentheses are heteroskedasticity-robust standard errors). where "Studenth" is the height of students in inches, and "Midparh" is the average of the parental heights. (a) Using a t-test approach and 5% level of significance, test if slope coefficient can be positive. Make sure you write both hypothesis claims properly. (b) If children, on average, were expected to be of the same height as their parents, then this would imply that the coefficient of intercept becomes zero and the coefficient of slope will be 1: (i) Test if the coefficient of intercept is zero at 1% level of significance. Test if the slope coefficient is 1 at 5% level of significance. (Note: the statistical table is attached hereto) (c) Repeat part (B)-(i) using the p-value approach. (d) Repeat part (B)-(ii) using the p-value approach.

MATLAB: An Introduction with Applications
6th Edition
ISBN:9781119256830
Author:Amos Gilat
Publisher:Amos Gilat
Chapter1: Starting With Matlab
Section: Chapter Questions
Problem 1P

Related questions
Question
5)
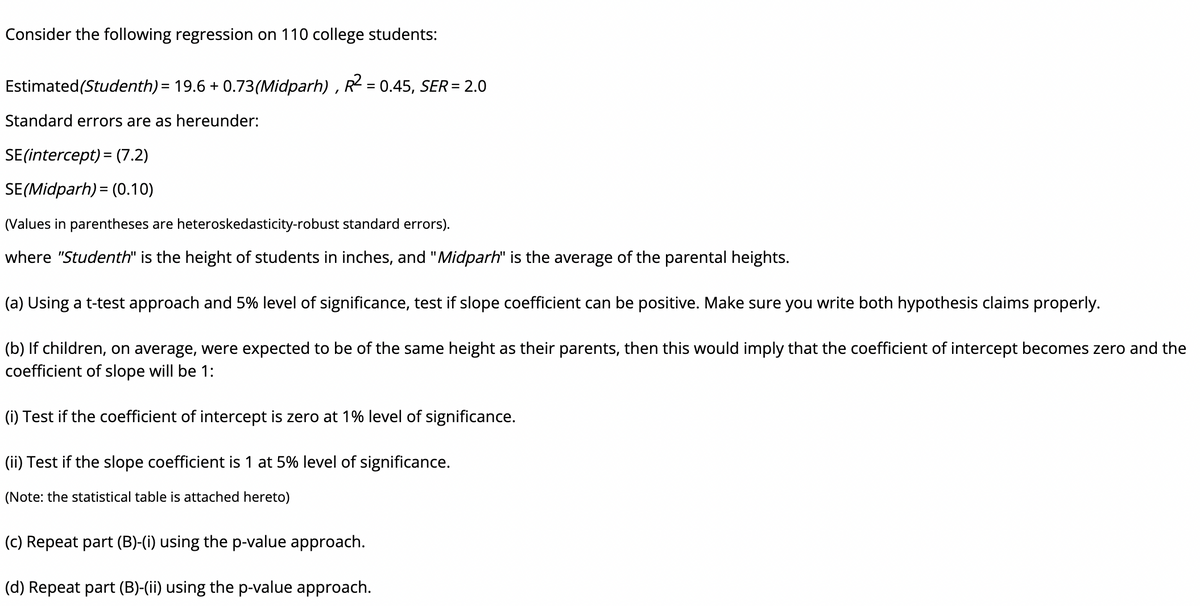
Transcribed Image Text:Consider the following regression on 110 college students:
Estimated(Studenth) = 19.6 + 0.73(Midparh) , R = 0.45, SER= 2.0
%3D
Standard errors are as hereunder:
SE(intercept) = (7.2)
SE(Midparh) = (0.10)
(Values in parentheses are heteroskedasticity-robust standard errors).
where "Studenth" is the height of students in inches, and "Midparh" is the average of the parental heights.
(a) Using a t-test approach and 5% level of significance, test if slope coefficient can be positive. Make sure you write both hypothesis claims properly.
(b) If children, on average, were expected to be of the same height as their parents, then this would imply that the coefficient of intercept becomes zero and the
coefficient of slope will be 1:
(i) Test if the coefficient of intercept is zero at 1% level of significance.
(ii) Test if the slope coefficient is 1 at 5% level of significance.
(Note: the statistical table is attached hereto)
(C) Repeat part (B)-(i) using the p-value approach.
(d) Repeat part (B)-(ii) using the p-value approach.
Expert Solution
This question has been solved!
Explore an expertly crafted, step-by-step solution for a thorough understanding of key concepts.

This is a popular solution!

Trending now
This is a popular solution!

Step by step
Solved in 2 steps with 13 images

Recommended textbooks for you
MATLAB: An Introduction with Applications
Statistics
ISBN:
9781119256830
Author:
Amos Gilat
Publisher:
John Wiley & Sons Inc

Probability and Statistics for Engineering and th…
Statistics
ISBN:
9781305251809
Author:
Jay L. Devore
Publisher:
Cengage Learning

Statistics for The Behavioral Sciences (MindTap C…
Statistics
ISBN:
9781305504912
Author:
Frederick J Gravetter, Larry B. Wallnau
Publisher:
Cengage Learning
MATLAB: An Introduction with Applications
Statistics
ISBN:
9781119256830
Author:
Amos Gilat
Publisher:
John Wiley & Sons Inc
Probability and Statistics for Engineering and th…
Statistics
ISBN:
9781305251809
Author:
Jay L. Devore
Publisher:
Cengage Learning
Statistics for The Behavioral Sciences (MindTap C…
Statistics
ISBN:
9781305504912
Author:
Frederick J Gravetter, Larry B. Wallnau
Publisher:
Cengage Learning

Elementary Statistics: Picturing the World (7th E…
Statistics
ISBN:
9780134683416
Author:
Ron Larson, Betsy Farber
Publisher:
PEARSON

The Basic Practice of Statistics
Statistics
ISBN:
9781319042578
Author:
David S. Moore, William I. Notz, Michael A. Fligner
Publisher:
W. H. Freeman

Introduction to the Practice of Statistics
Statistics
ISBN:
9781319013387
Author:
David S. Moore, George P. McCabe, Bruce A. Craig
Publisher:
W. H. Freeman