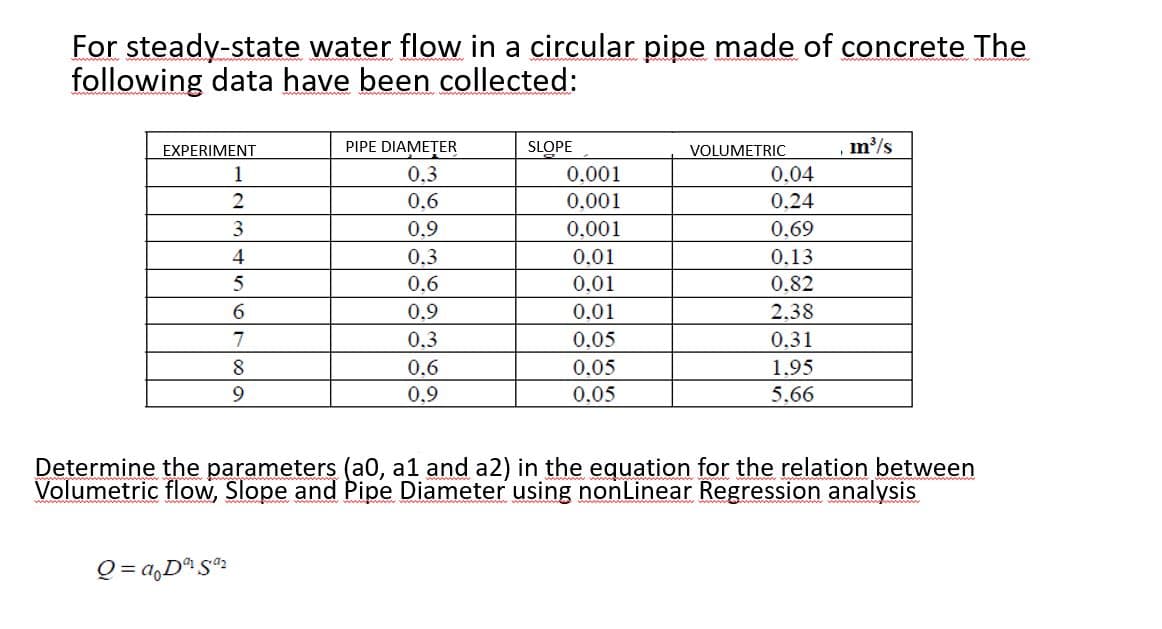
For steady-state water flow in a circular pipe made of concrete The following data have been collected: PIPE DIAMETER m/s SLOPE 0.001 EXPERIMENT VOLUMETRIC 1 0,3 0.04 0.6 0,001 0.24 3 0.9 0.001 0.69 4 0,3 0.01 0,13 5 0.6 0.01 0.82 0.9 0.01 2.38 0,3 0.05 0,31 7 0.6 0.05 0.05 1.95 5.66 0.9


Q: An article in the Journal of Sound and Vibration (Vol. 151, 1991, pp. 383-394) described a study…
A:
Q: 1. Corrosion of still reinforcing bars is the most important durability problem for reinforced…
A: Note: Hey there! Thank you for the question. As you have posted several sub-parts of a question,…
Q: For this experiment, it is desired to investigate the relationship between air inlet temperature and…
A: Consider the given data that contains the intel temperature (x) and the removal efficiency (y).…
Q: An article in the Journal of Sound and Vibration (Vol. 151, 1991, pp. 383-394) described a study…
A: For the given data Y intercept =?
Q: A researcher interested in explaining the level of foreign reserves for the country of Barbados…
A: As we've Calculated that, p-value= 0.0294 We state the hypothesis, Ho: The result is Statistically…
Q: QUESTION-2 Consider the following process capability values where the specification limits are 45 t…
A: Since you have posted a question with multiple sub-parts, we will solve the first three sub-parts…
Q: 2. The authors of the paper "Age, Spacing and Growth Rate of Tamarix as an Indication of Lake…
A: a/b). Given, the data on vigor and stem density. The excel step to obtain the scatter plot for the…
Q: An article in Technometrics (1974, Vol. 16, pp. 523–531) considered the following stack-loss data…
A: Consider the stack loss data from a plant oxidizing ammonia to nitric acid. Twenty one daily…
Q: The data given below indicate the existence of a linear relationship between the x and y variables.…
A: Use the following formulae, to find the linear relationship between x and y.…
Q: Plasma etching is essential to the fine-line pattern transfer in current semiconductor processes. An…
A: Given :The Plasma etching is essential to the fine-line pattern transfer in current semiconductor…
Q: A study measures the sorption rate of three different types of organic chemical solvents. These…
A: Given :
Q: Carbon monoxide (CO) concentrations are sampled at 20 intersections in heavy-traffic areas of a…
A: Level of Significance is the probability of rejecting a null hypothesis when it is true. In other…
Q: We are using the average baseball player’s salary from 2003 through 2020 to fit different…
A: Third order autoregressive model: Let us consider the third order autoregressive model as, Given…
Q: For this experiment, it is desired to investigate the relationship between air inlet temperature and…
A: As per guidelines we will solve the first question only, please repost other questions for more…
Q: consider the following sample of production volumes and total cost data for manuracturing operation.…
A: The null hypothesis in simple linear regression is that the slope is zero and the alternate…
Q: The article "Characterization of Effects of Thermal Property of Aggregate on the Carbon Footprint of…
A: Given CO2 emissions at various temperature Temperature Emissions 160 9.52 14.1 7.43…
Q: In Applied Spectroscopy, the infrared reflectance spectra properties of a viscous liquid used in the…
A: Multiple regression: If the data set is multiple, then linear regression best suits the data. The…
Q: Consider the following log-wage regression results for women (W) and men (M) where wages are…
A:
Q: The data below are from an independent-measures experiment comparing three different treatment…
A: Given Information: Total no. of treatments=03No. of observations (n)=12
Q: Table 8.1: Selected Excel output from a simple linear regression of levels of stress and average…
A: In this case, the independent variable is hours of cycling (x) and the dependent variable is levels…
Q: In the semi-conductor manufacturing plant example, compute for the predicted value (ŷ) of…
A:
Q: A paper gives data on x- change in Body Mass Index (BMI, in kilograms/meter*) and y- change in a…
A:
Q: An article in the Journal of Sound and Vibration (Vol. 151, 1991, pp. 383-394) described a study…
A: Use EXCEL to determine the regression equation. EXCEL procedure: Go to EXCEL Go to Data>Data…
Q: the dexes calculated for (2019-2020) and the Regression Model parameters are given as follows:…
A:
Q: A researcher interested in explaining the level of foreign reserves for the country of Barbados…
A: (a)
Q: A logistic regression model was proposed for classifying common brushtail possums into their two…
A: It was stated that a logistic regression model was proposed for dividing common brushtail possums…
Q: An article in the Journal of Sound and Vibration (Vol. 151, 1991, pp. 383-394) described a study…
A: For the given data Find Slope =?
Q: Here is the dataset containing plant growth measurements, e of plants grown in solutions of…
A: Given information: Distilled H2O Petro NACl MgCl NaCl + MgCl 20 19.84 20 19.88 19.93 19.95…
Q: A-) Find the correlation coefficient between the streams at the two stations. B-) Determine whether…
A: B (X) A (Y) (x-xbar) (x-xbar)^2 (y-ybar) (y-ybar)^2 (x-xbar)*(y-ybar) 130.19 40.41 -62.1786…
Q: 8) The relationship between the TSLS slope and the corresponding population parameter is: (Z; - Zju;…
A: Since you have asked multiple question, we will solve the first question for you. If youwant any…
Q: The following table shows the average life expectancy, in years, of a child born in the given year.†…
A: Step-by-step procedure to obtain the regression equation using MINITAB:Choose Stat > Regression…
Q: Question-1 a. The density of molten salt mixtures, g/cm³, was measured at various temperatures Cº.…
A: Let the density of molten salt mixtures is y g/cm3 Let the measured temperature is x° C. The given…
Q: The table lists fosil tuel production as a persentage of total energy production for seiected years.…
A: Consider the given data of the year and the fossil production given as percentage of total energy.…
Q: The following data on the percentage of the high-performance radial tires made by a certain…
A: Given n=8
Q: 3. The signal (peak area) measured for different standard concentrations of silver in atomic…
A: From the given information, Consider, Y = peak area that needs to be measured and X1 =Ag , X2 =…
Q: Velocidad del aire (cm/s) Coeficiente de evaporación (mm²/s) 20 0.18 60 0.37 100 0.35 140 0.78 180…
A: Now, with the provided sample values of the predictor and the response variable, we need to…
Q: = 1, 2, 3, and 4 respectively.) 1.6: 59.9 53.5 56.7 63.2 58.6 3.8: 55.6 59.6 52.6 54.5 6.0: 51.2…
A: We want find the value of F and p value.
Q: Reliability testing of the new 2.0 liter Chevy automotive engine has resulted in a time to failure…
A: Given information: tmed=90,000 miless=0.60
Q: An article contained the following observations on degree of polymerization for paper specimens for…
A: Mean is the measure used to determine the average measure of the data set. Standard deviation is…
Q: An article in the Journal of Sound and Vibration (Vol. 151, 1991, pp. 383-394) described a study…
A: The dependent variable is y. The independent variable is x. We have to find the least squares…
Q: The following data is representative of that reported in the article "An Experimental Correlation of…
A:
Q: An article contained the following observations on degree of polymerization for paper specimens for…
A: Box plot: Step-by-step procedure to draw the box plot using EXCEL software: Select the data and…
Q: e)* Does a linear regression function appear to give a good fit here? Compare and contrast with the…
A: e) The linear regression equation in the first data is; Width = 1.214 + 0.259 * Length The…
Q: In a company introducing a new product on the market it was decided to build a model explaining the…
A: Given information: It is given that a company is introducing a new product on the market and it was…
Q: The following table shows the typical depth (rounded to the nearest foot) for nonfailed wells in…
A:
Q: A dry gas reservoir has produced as follows: Data Static Res. Pressure Cumulative production MM SCF…
A: Production data for a dry reservoir as follows :- Date Cumulative Production MMSCF Static Res,…
Q: 2. The breakdown time (in minutes) of an insulating fluid between electrodes at 34 kV are reported…
A: Given that the data are…
Q: Consider the following estimated model, where the dependent variable is the log of the hourly wage:…
A: logwage^=0.417-0.238 female+0.17educ+0.0232 exper -0.0005exper2+0.0295 tenure-0.00059 tenure2…
Q: The following table gives the regression results of consumption behaviour between female and male.…
A: Note: Hey there! Thank you for the question. As you have posted multiple sub-parts, we have helped…
Q: TABLE · E11-14 Fastener Failure Data Load, x (psi) Sample Size, n 2500 Number Failing, r 10 50 2700…
A:


Trending now
This is a popular solution!

Step by step
Solved in 3 steps with 1 images


- Compute the forecasted values for Yt for July and August in 2020 by using the modelsstated in (c) and (d)The Turbine Oil Oxidation Test (TOST) and the Rotating Bomb Oxidation Test (RBOT) are two different procedures for evaluating the oxidation stability of steam turbine oils. An article reported the accompanying observations on x = TOST time (hr) and y = RBOT time (min) for 12 oil specimens. TOST 4200 3600 3750 3650 4050 2770 RBOT 370 345 375 315 350 205 TOST 4870 4525 3450 2700 3750 3325 RBOT 400 380 285 220 345 290 (a) Calculate the value of the sample correlation coefficient. (Round your answer to four decimal places.) r = Carry out a test of hypotheses to decide whether RBOT Time and TOST time are linearly related. (Use ? = 0.05.) Calculate the test statistic and determine the P-value. (Round your test statistic to two decimal places and your P-value to three decimal places.) t = P-value =The accompanying dataset provides data on the monthly usage of natural gas (in millions of cubic feet) for a certain region over two years. Implement the Holt-Winters multiplicative seasonality model with no trend to find the forecast for periods 13-26, where alphaαequals=0.50.5 and gammaγequals=0.80.8. Then find the MAD for periods 13-24. Month Period Gas Usage Jan 1 242 Feb 2 227 Mar 3 153 Apr 4 144 May 5 55 Jun 6 34 Jul 7 29 Aug 8 27 Sep 9 28 Oct 10 40 Nov 11 88 Dec 12 203 Jan 13 231 Feb 14 248 Mar 15 251 Apr 16 139 May 17 35 Jun 18 32 Jul 19 28 Aug 20 26 Sep 21 27 Oct 22 38 Nov 23 86 Dec 24 182 Use the Holt-Winters multiplicative seasonality model with no trend to find the forecast for periods 13-18, periods 19-24, and then for periods 25 and 26. (Type integers or decimals rounded to two decimal places as needed.) Period Forecast 13 14 15 16 17 18
- Determine the critical values of r and if it represents a significant linear correlation.Cell Phone Radiation Listed below are the measured radiation absorption rates (in W/kg) corresponding to these cell phones: iPhone 5S, BlackBerry Z30, Sanyo Vero, Optimus V, Droid Razr, Nokia N97, Samsung Vibrant, Sony Z750a, Kyocera Kona, LG G2, and Virgin Mobile Supreme. The data are from the Federal Communications Commission. If one of each model of cell phone is measured for radiation and the results are used to find the measures of variation, are the results typical of the population of cell phones that are in use?The following partial JMP regression output for the Fresh detergent data relates to predicting demand for future sales periods in which the price difference will be .10. SE Fit = .165360573, s = .628152. Predicted Demand Lower 95% MeanDemand Upper 95% MeanDemand 31 8.181072245 7.842346262 8.519798229 StdErr IndivDemand Lower 95% IndivDemand Upper 95% MeanDemand 0.649552965 6.850522511 9.511621980 Click here for the Excel Data File (a) Report a point estimate of and a 95 percent confidence interval for the mean demand for Fresh in all sales periods when the price difference is .10. (Round your CI answers to 3 decimal places and other answer to 4 decimal places.) (b) Report a point prediction of and a 95 percent prediction interval for the actual demand for Fresh in an individual sales period when the price difference is .10. (Round your PI answers to 3 decimal places and other answer to 4 decimal places.) (c) StdErr Indiv Demand on…
- ) The following table shows 10 communities ranked by decayed, missing, or filled (DMF) teeth per 100 children and fluoride concentration in ppm in the public water supply: Rank by DMF Teeth FluorideCommunity per 100 children X Concentration Y 1 8 1 2 9 3 3 7 4 4 3 9 5 2 8 6 4 77 1…Here is a dataset containing plant growth measurements of plants grown in solutions of commonly-found chemicals in roadway runoff.Phragmites australis, a fast-growing non-native grass common to roadsides and disturbed wetlands of Tidewater Virginia, was grown in a greenhouse and watered with either: Distilled water (control); A weak petroleum solution (representing standard roadway runoff); Sodium chloride solution; Magnesium chloride solution; De-icing brine (50% sodium chloride and 50% magnesium chloride).Twenty grass preparations were used for each solution, and total growth (in cm) was recorded after watering every other day for 40 days.-Perform the correct statistical test to determine the p-value.-Report your answer rounded to four decimal places.-You should use formulas, functions, and the Data Analysis ToolPak in MS Excel to avoid additive rounding errors. Here are some useful functions: =t.test(array1,array2,tails,type) Produces a p-value for any…A paper investigated the driving behavior of teenagers by observing their vehicles as they left a high school parking lot and then again at a site approximately 1 2 mile from the school. Assume that it is reasonable to regard the teen drivers in this study as representative of the population of teen drivers. Amount by Which Speed Limit Was Exceeded MaleDriver FemaleDriver 1.2 -0.1 1.4 0.4 0.9 1.1 2.1 0.7 0.7 1.1 1.3 1.2 3 0.1 1.3 0.9 0.6 0.5 2.1 0.5 (a) Use a .01 level of significance for any hypothesis tests. Data consistent with summary quantities appearing in the paper are given in the table. The measurements represent the difference between the observed vehicle speed and the posted speed limit (in miles per hour) for a sample of male teenage drivers and a sample of female teenage drivers. (Use μmales − μfemales.Round your test statistic to two decimal places. Round your degrees of freedom down to the nearest whole number. Round your p-value to…
- A paper investigated the driving behavior of teenagers by observing their vehicles as they left a high school parking lot and then again at a site approximately 1 2 mile from the school. Assume that it is reasonable to regard the teen drivers in this study as representative of the population of teen drivers. Amount by Which Speed Limit Was Exceeded MaleDriver FemaleDriver 1.3 -0.1 1.3 0.4 0.9 1.1 2.1 0.7 0.7 1.1 1.3 1.2 3 0.1 1.3 0.9 0.6 0.5 2.1 0.5 (a) Use a .01 level of significance for any hypothesis tests. Data consistent with summary quantities appearing in the paper are given in the table. The measurements represent the difference between the observed vehicle speed and the posted speed limit (in miles per hour) for a sample of male teenage drivers and a sample of female teenage drivers. (Use μmales − μfemales.Round your test statistic to two decimal places. Round your degrees of freedom down to the nearest whole number. Round your p-value to…Obtain the appropriate measure of dispersion for age and both income variables. DATA Subject Gender Marital Status Age Education Household Income Personal Income 1 F 1 30 0 70000.00 40000.00 2 F 0 40 0 32500.00 32500.00 3 M 1 45 0 42000.00 .0 4 M 1 23 0 50000.00 50000.00 5 M 0 50 0 4500.00 4500.00 6 F 0 65 1 40000.00 22000.00 7 F 1 33 1 12000.00 12000.00 8 F 0 20 2 56000.00 52000.00 9 F missing 30 3 17500.00 17500.00 10 M 1 Missing 4 44000.00 39000.00 11 M 2 58 1 missing missing 12 M 2 32 2 10000.00 10000.00 13 M 1 35 3 missing missing 14 F 2 23 4 100000.00 50000.00 15 F 2 34 1 64000.00 64000.00 16 M 1 26 2 Missing missing 17 M 1 36 3 missing missing 18 F 0 41 4 7500.00 5500.00 19…Consider the following service system. a) The average inter-arrival time is 10 minutes, and the standard deviation of the inter-arrival time is 10 minutes. b) The average processing time is 5 minutes with the standard deviation of the processing time being 6 minutes. What is the Demand of the process in [customers/minute]? What is the Flow rate of the process in [customers/minute]?
