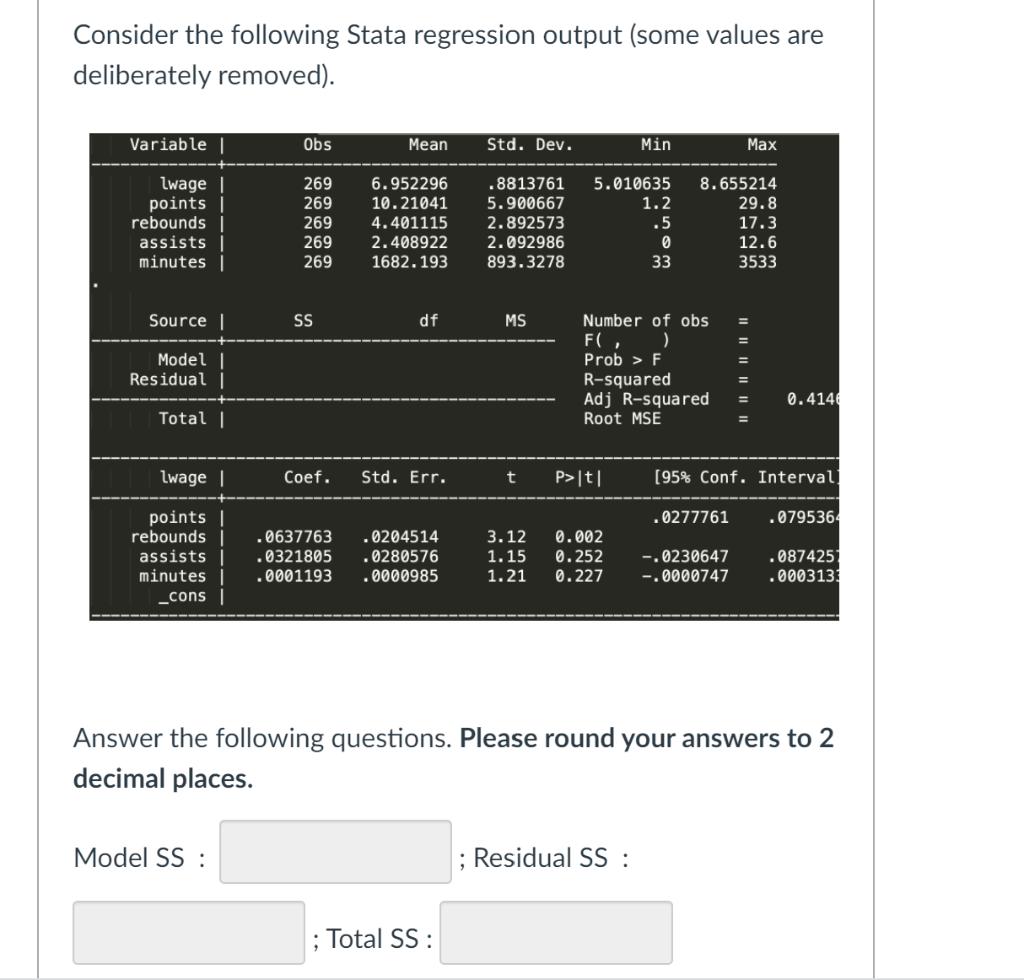
Consider the following Stata regression output (some values are deliberately removed). Variable | Obs Mean Std. Dev. Min Маx lwage | 269 6.952296 .8813761 5.010635 8.655214


Q: A researcher is investigating why students choose GIMPA to study Public Administration. The…
A: We can State hypothesis for every independent variables. H01: The cost affects the choice of…
Q: If a p-value reported in the Excel linear regression output associated with a particular variable is…
A: The p-value is 0.0014.
Q: A 3-year study was carried out to see if fluoride toothpaste helps to prevent cavities. The…
A: Given data n1=260, x̄1=12.83, s1=8.31, n2=289, x̄2 =9.78, s2=7.51, level of significance=ɑ=0.01
Q: Use the following ANOVA table for regression to answer the questions. Analysis of Variance Source…
A: We need to answer question using the concept of Analysis of Variance
Q: A sample of n = 120 scores were presented using the Tenacity (authority) scores to the following…
A:
Q: Given the following ANOVA table, calculate the F-ratio and the F critical values. ANOVA for…
A: Correct option is 2nd
Q: A sample of n = 120 scores were presented using the Tenacity (authority) scores to the following…
A:
Q: A multiple regression analysis between yearly income(y in $1,000s), college grade point average(X1)…
A: “Since you have posted a question with multiple sub-parts, we will solve first three sub- parts for…
Q: Not all choices on the right will necessarily be used. Select a letter from the choices on the right…
A: We want find symbols some statistics term like correlation, determination , variance...
Q: Draw a normal curve and label it with the following items for a two-tailed hypothesis. a. Alpha…
A: Given information Two tailed Hypothesis P( Z < -z) +P(Z>z) = 0.05 2P(Z < -z) = 0.05
Q: Which of the following choices correctly identifies the following Q-Q plots for the normality of…
A: In this case, we need to identify the correct option of the given question.
Q: Which of the following represents a 98 percent confidence interval for the slope of the…
A: here given slope of regression line = 0.161 standard error of slope = 0.073 confidence level 98%…
Q: Use the following ANOVA table for regression to answer the questions. Analysis of Variance Source…
A: The table shows the ANOVA table for regression.
Q: A sample of n = 120 scores were presented using the Tenacity (authority) scores to the following…
A: Given info: The p value for the multiple regression analysis for 1. tenacity and voice is 0.001.…
Q: A sample of n = 120 scores were presented using the Tenacity (authority) scores to the following…
A: The level of significance is 0.05.
Q: A sample of n= 120 scores were presented using the tendency(authority) scores to the following…
A: We want to tell you we reject or can't reject the null hypothesis. Given ɑ=0.05
Q: In December 2006, the International Breastfeeding Journal published results of a study conducted at…
A:
Q: A Simple Linear Regression (SLR) was performed where the monthly Revenue ("Rev", the y-variable) was…
A: Confidence Interval: The following is the formula for slope coefficient where B1 is the slope…
Q: Use the following ANOVA table for regression to answer the questions. Analysis of Variance Source…
A:
Q: A sample of n = 120 scores were presented using the Tenacity (authority) scores to the following…
A:
Q: With the growth of cryptocurrency providers, an IT researcher decides to test out whether there is…
A: To answer C and D Questions we have to fit a linear regression equation.
Q: Based on the ANOVA table given, is there enough evidence at the 0.010.01 level of significance to…
A: It is needed to test whether the linear relationship between the independent variables and the…
Q: Use an analysis of variance with α = .05 to determine whether these data indicate any significant…
A: For the given data Perform Anova single factor
Q: For screened coke, the porosity factor is measured by the difference in weight between dry and…
A: Assume that μ defines the true porosity factor of coke.
Q: Use the following ANOVA table for regression to answer the questions. Analysis of Variance Source…
A: From the given information, the ANOVA table for regression analysis is, Source DF SS MS…
Q: Based on the following table, what is the sample regression equation? Standard Coefficients Error t…
A: We have been given the output of regression. We have the regression equation given as,…
Q: A sample of n = 120 scores were presented using the Tenacity (authority) scores to the following…
A: reject Ho and accept Ha
Q: The following data pertain to the marks in subjects A and B in a certain examination. Mean marks in…
A:
Q: Consider the following summary output, which was generated from a sample of 8 employees relating age…
A: From the given data R^2 = ? R^2 = 0.019068636
Q: Based on the ANOVA table given, is there enough evidence at the 0.01 level of significance to…
A: The significance value is 0.009990.
Q: The department of health studied the amount of reported hepatitis C cases in a country. The…
A: The independent variable is age. The dependent variable is number of infected people. We have to…
Q: Let X be a random sample from Exp(e). a. Find the CRLB for variance of any estimator b. Find CSS. c.…
A:
Q: Included observations: 13 Variable Coefficient Std. Error t-Statistic Prob. Intercept Years of…
A: In simple linear regression, there is only one dependant variable and one independent variable. The…
Q: Based on the ANOVA table given, is there enough evidence at the 0.05 level of significance to…
A: The significance value is 0.497712
Q: A sample of n = 120 scores were presented using the Tenacity (authority) scores to the following…
A:
Q: Vol. 167, No. 4). Use a 0.05 significance level to test the claim that with garlic treatment, the…
A: It is given that Mean change Md = 0.4 SD of change, Sd = 21.0 Sample size n = 49 Level of…
Q: The department of health studied the amount of reported hepatitis C cases in a country. The…
A: The hypothesis is, Null hypothesis: H0: There is no linear relationship between the number of…
Q: The following SPSS output examines the percent of security staff that is female at private and…
A: Given the SPSS output examines the percent of security staff that is female at private and public…
Q: According to human capital theory, a person’s earning is linked to her level of education – there is…
A: According to human capital theory, a person’s earning is linked to her level of education – there is…
Q: A sample of n= 120 scores were presented using the tendency(authority) scores to the following…
A: Note: According to Bartleby, expert solve only one question and maximum 3 subpart of the first…
Q: Which choice would be correct? Extraneous variables that are not directly studied but may influence…
A:
Q: Use the following ANOVA table for regression to answer the questions. Analysis of Variance Source DF…
A:
Q: 3374.2 3374.2 20.7 0.000 Residual Error 174 28362.0 163.0 Total 175 31736.2
A: Given : Analysis of Variance Source DF SS MS F P Regression 1 3374.2 3374.2 20.7 0.000…
Q: The following output was obtained from a multiple regression analysis. Analysis of variance…
A: Given, Predictor Coefficient SE T Intercept 3 1.5 2 X1 4 3 1.33 X2…
Q: The following ANOVA table is generated from a data set considering one regressor: Source of F- F- P-…
A: Here given anova table. We have to calculate R^2 of the best - fit line for the regression analysis
Q: The following output was obtained from a multiple regression analysis. Analysis of variance…
A:
Q: Use the following ANOVA table for regression analysis to compute the adjusted R value. ANOVA df SS…
A:
Q: The following ANOVA table is generated from a data set considering one regressor: F- P- F- df SS MS…
A: From the Anova table R2 = ?
Q: Use the following data on distance and interaction frequency: y Interaction frequency 10.3 x…
A: Given data on distance and interaction frequency. We have to calculate standard error of estimate.

Step by step
Solved in 2 steps

- Which of the following scatterplots provides evidence that the condition of equal variance for inference for the slope of a regression line has not been met?A sample of n = 120 scores were presented using the Tenacity (authority) scores to the following predictors: age gender, SES, tone of voice, and clothing. Using a two-tailed test at the 0.05 level of significance, a multiple regression analysis was computed: 1. tenacity and age (pvalue = 0.043) Using the pvalue, provide your DECISION, whether: Accept Ho or Reject Ho, Accept HaA sample of n = 120 scores were presented using the Tenacity (authority) scores to the following predictors: age gender, SES, tone of voice, and clothing. Using a two-tailed test at the 0.05 level of significance, a multiple regression analysis was computed: 1. tenacity and age (pvalue = 0.043); 2. tenacity and gender (pvalue = 0.102); 3. tenacity and SES (pvalue = 0.40); Using the pvalue, provide your DECISION, whether: Accept Ho or Reject Ho, Accept Ha
- A sample of n = 120 scores were presented using the Tenacity (authority) scores to the following predictors: age gender, SES, tone of voice, and clothing. Using a two-tailed test at the 0.05 level of significance, a multiple regression analysis was computed: 2. tenacity and gender (pvalue = 0.102); Using the pvalue, provide your DECISION, whether: Accept Ho or Reject Ho, Accept HaA sample of n = 120 scores were presented using the Tenacity (authority) scores to the following predictors: age gender, SES, tone of voice, and clothing. Using a two-tailed test at the 0.05 level of significance, a multiple regression analysis was computed: 5. tenacity and clothing (value = 0.017); SOrs Using the pvalue, provide your DECISION, whether: Accept Ho or Reject Ho, Accept HaA sample of n = 120 scores were presented using the Tenacity (authority) scores to the following predictors: age gender, SES, tone of voice, and clothing. Using a two-tailed test at the 0.05 level of significance, a multiple regression analysis was computed: 1. tenacity and age (pvalue = 0.043); 2. tenacity and gender (pvalue = 0.102); 3. tenacity and SES (pvalue = 0.40); 4. tenacity and voice (pvalue = 0.001); 5. tenacity and clothing (value = 0.017); SOrs Using the pvalue, provide your DECISION, whether:Accept Ho or Reject Ho, Accept Ha
- A sample of n = 120 scores were presented using the Tenacity (authority) scores to the following predictors: age gender, SES, tone of voice, and clothing. Using a two-tailed test at the 0.05 level of significance, a multiple regression analysis was computed: 1. tenacity and voice (pvalue = 0.001); 2. tenacity and clothing (pvalue = 0.017); Using the pvalue, provide your DECISION, whether: Accept Ho or Reject Ho, Accept HaIf the standard error of the estimate for a regression model fitted to a large number of paired observations is 1.75, approximately 95% of the residuals would lie within ______. −3.50 and +3.50 −1.75 and +1.75 −0.95 and +0.95 −0.68 and +0.68 −0.97 and +0.97Suppose that a sample of n = 12 pairs of X and Y scores has SSY = 90 and a Pearson correlation of r = +0.40. Does the regression equation predict a significant portion of the variance? Test with α = .05.(hint: SStotal = SSY; r2 = SSregression/SSTotal)
- The following measurements correspond to air velocity and the evaporation coefficient of burned fuel droplets in a boost engine. Construct a 95% confidence interval for the regression coefficient alpha.A multiple regression analysis produced the following tables. Predictor Coefficients StandardErrort Statistic p-valueIntercept -139.609 2548.989 -0.05477 0.957154x 24.24619 22.25267 1.089586 0.295682x 32.10171 17.44559 1.840105 0.08869Source df SS MS F p-valueRegression 2 302689 151344.5 1.705942 0.219838Residual 13 1153309 88716.07Total 15 1455998Using = 0.01 to test the null hypothesis H :?1 = ?2 = 0, the critical F value is ____.6.701.964.845.995.70Bill is the office manager for a group of financial advisors who provide financial services for individual clients. She would like to investigate whether a relationship exists between the number of presentations made to prospective clients in a month and the number of new clients per month. The following table shows the number of presentations and corresponding new clients for a random sample of six employees. Employee Presentations New Clients 1 2 1 2 8 2 3 9 4 4 10 3 5 11 5 6 12 6 Bill would like to use simple regression analysis to estimate the number of new clients per month based on the number of presentations made by the employee per month. The average number of new clients per month for an employee who made 20 presentations per month is ________. 5.02 5.45 3.43 8.69