Consider the following table. (Note: This exercise corresponds to the subsection Model Choices.) Production, Given the Amount Invested in Capital Capital, x (million dollars) Production, P (billion units) 6 20 18 37 24 41 30 42 59 48 78 (a) Describe the behavior suggested by a scatter plot of the data and list the types of models that exhibit this behavior A scatter plot of the data isSelect and appears to have an inflection point near x = 24. The scatter plot is concaveSelect to the left of x 24 and concaveSelect to the right of x 24. This behavior suggests a -Select function. (b) Describe the possible end behavior as input increases and list the types of models that would fit each possibility. OProduction should decrease without bound as capital expenditure increases. A cubic, quadratic, logarithmic, or exponential model would fit this possibility. Production should continue to increase without bound as capital expenditure increases. A cubic, quadratic, logarithmic, or exponential model would fit this possibility. OProduction should continue to increase to a limiting value as capital expenditure increases. A logistic model would fit this possibility. Production should approach 0 as capital expenditure increases. A logistic model would fit this possibility. (c) Write the function of the model that best fits the data of the production level in billion units, where x million dollars is invested in capital, with data from 6 x S 48. (Round all numerical values to four decimal places.) P(x) (d) Write the function of the model that best exhibits the end behavior of the data of the production level in billion units, where x million dollars is invested in capital, with data from 6 xs 48. (Round all numerical values to four decimal places.) P(x) =
Consider the following table. (Note: This exercise corresponds to the subsection Model Choices.) Production, Given the Amount Invested in Capital Capital, x (million dollars) Production, P (billion units) 6 20 18 37 24 41 30 42 59 48 78 (a) Describe the behavior suggested by a scatter plot of the data and list the types of models that exhibit this behavior A scatter plot of the data isSelect and appears to have an inflection point near x = 24. The scatter plot is concaveSelect to the left of x 24 and concaveSelect to the right of x 24. This behavior suggests a -Select function. (b) Describe the possible end behavior as input increases and list the types of models that would fit each possibility. OProduction should decrease without bound as capital expenditure increases. A cubic, quadratic, logarithmic, or exponential model would fit this possibility. Production should continue to increase without bound as capital expenditure increases. A cubic, quadratic, logarithmic, or exponential model would fit this possibility. OProduction should continue to increase to a limiting value as capital expenditure increases. A logistic model would fit this possibility. Production should approach 0 as capital expenditure increases. A logistic model would fit this possibility. (c) Write the function of the model that best fits the data of the production level in billion units, where x million dollars is invested in capital, with data from 6 x S 48. (Round all numerical values to four decimal places.) P(x) (d) Write the function of the model that best exhibits the end behavior of the data of the production level in billion units, where x million dollars is invested in capital, with data from 6 xs 48. (Round all numerical values to four decimal places.) P(x) =

Algebra & Trigonometry with Analytic Geometry
13th Edition
ISBN:9781133382119
Author:Swokowski
Publisher:Swokowski
Chapter3: Functions And Graphs
Section3.3: Lines
Problem 76E

Related questions
Question
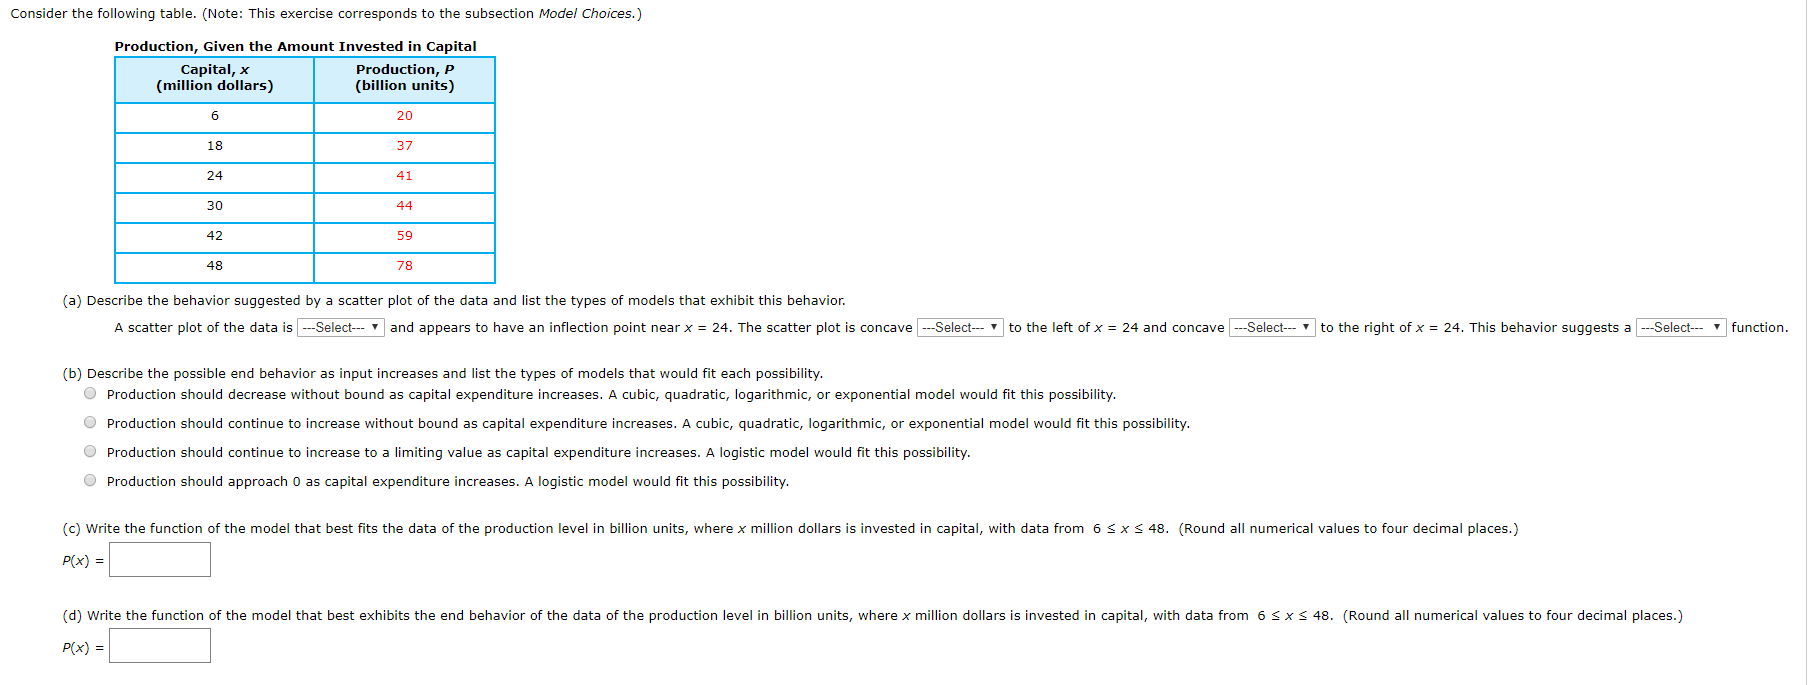
Transcribed Image Text:Consider the following table. (Note: This exercise corresponds to the subsection Model Choices.)
Production, Given the Amount Invested in Capital
Capital, x
(million dollars)
Production, P
(billion units)
6
20
18
37
24
41
30
42
59
48
78
(a) Describe the behavior suggested by a scatter plot of the data and list the types of models that exhibit this behavior
A scatter plot of the data isSelect
and appears to have an inflection point near x = 24. The scatter plot is concaveSelect
to the left of x 24 and concaveSelect
to the right of x
24. This behavior suggests a -Select
function.
(b) Describe the possible end behavior as input increases and list the types of models that would fit each possibility.
OProduction should decrease without bound as capital expenditure increases. A cubic, quadratic, logarithmic, or exponential model would fit this possibility.
Production should continue to increase without bound as capital expenditure increases. A cubic, quadratic, logarithmic, or exponential model would fit this possibility.
OProduction should continue to increase to a limiting value as capital expenditure increases. A logistic model would fit this possibility.
Production should approach 0 as capital expenditure increases. A logistic model would fit this possibility.
(c) Write the function of the model that best fits the data of the production level in billion units, where x million dollars is invested in capital, with data from 6 x S 48. (Round all numerical values to four decimal places.)
P(x)
(d) Write the function of the model that best exhibits the end behavior of the data of the production level in billion units, where x million dollars is invested in capital, with data from 6 xs 48. (Round all numerical values to four decimal places.)
P(x) =
Expert Solution
This question has been solved!
Explore an expertly crafted, step-by-step solution for a thorough understanding of key concepts.

This is a popular solution!

Trending now
This is a popular solution!

Step by step
Solved in 6 steps with 5 images

Recommended textbooks for you
Algebra & Trigonometry with Analytic Geometry
Algebra
ISBN:
9781133382119
Author:
Swokowski
Publisher:
Cengage

Big Ideas Math A Bridge To Success Algebra 1: Stu…
Algebra
ISBN:
9781680331141
Author:
HOUGHTON MIFFLIN HARCOURT
Publisher:
Houghton Mifflin Harcourt
Algebra & Trigonometry with Analytic Geometry
Algebra
ISBN:
9781133382119
Author:
Swokowski
Publisher:
Cengage
Big Ideas Math A Bridge To Success Algebra 1: Stu…
Algebra
ISBN:
9781680331141
Author:
HOUGHTON MIFFLIN HARCOURT
Publisher:
Houghton Mifflin Harcourt