Consider the following time series data. Quarter Year 1 Year 2 Year 3 4 6. 3 5 7 3 6. a. Choose the correct time series plot. (i) 9 8 7 1234t
Consider the following time series data. Quarter Year 1 Year 2 Year 3 4 6. 3 5 7 3 6. a. Choose the correct time series plot. (i) 9 8 7 1234t

Advanced Engineering Mathematics
10th Edition
ISBN:9780470458365
Author:Erwin Kreyszig
Publisher:Erwin Kreyszig
Chapter2: Second-order Linear Odes
Section: Chapter Questions
Problem 1RQ

Related questions
Question
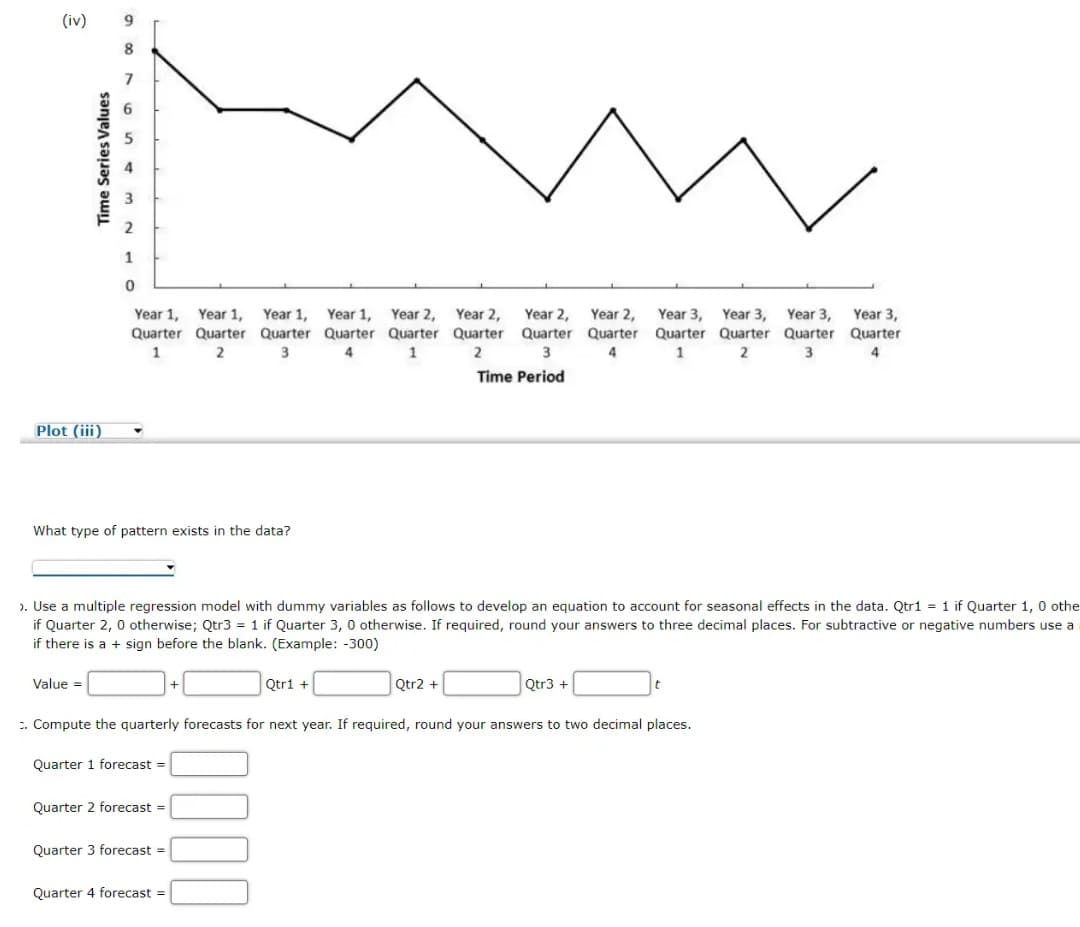
Transcribed Image Text:(iv)
9.
Year 1, Year 1, Year 1,
Quarter Quarter Quarter Quarter Quarter Quarter
Year 1,
Year 2,
Year 2,
Quarter Quarter
Year 2,
Year 2,
Year 3, Year 3, Year 3,
Year 3,
Quarter Quarter Quarter Quarter
1
3
4.
1
2
3
4
1
4
Time Period
Plot (iii)
What type of pattern exists in the data?
). Use a multiple regression model with dummy variables as follows to develop an equation to account for seasonal effects in the data. Qtr1 = 1 if Quarter 1, 0 othe
if Quarter 2, 0 otherwise; Qtr3 = 1 if Quarter 3, 0 otherwise. If required, round your answers to three decimal places. For subtractive or negative numbers use a
if there is a + sign before the blank. (Example: -300)
Value =
Qtri +
Qtr2 +
Qtr3 +
:. Compute the quarterly forecasts for next year. If required, round your answers to two decimal places.
Quarter 1 forecast =
Quarter 2 forecast =
Quarter 3 forecast =
Quarter 4 forecast =
Time Series Values
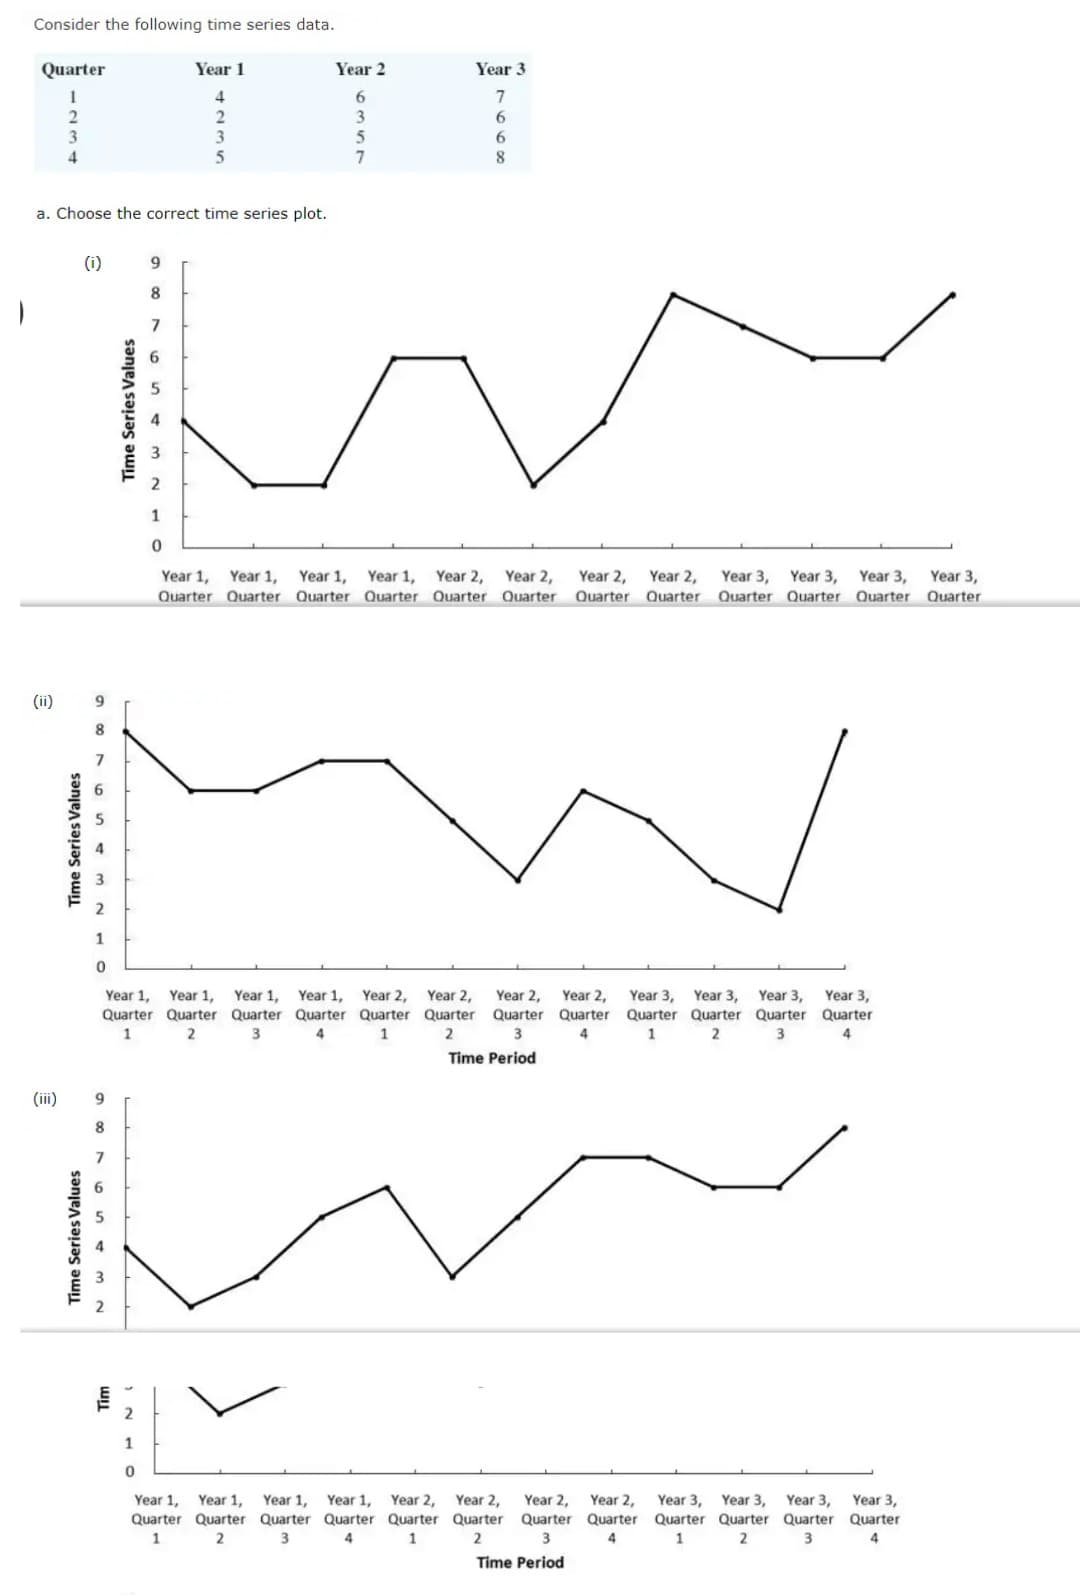
Transcribed Image Text:Consider the following time series data.
TITT
Quarter
Year 1
Year 2
Year 3
4
2
3
6
4
8
a. Choose the correct time series plot.
(i)
7
1
Year 1,
Year 2,
Year 2,
Quarter Ouarter Quarter Quarter
Year 1,
Year 1,
Year 1,
Year 2,
Year 2,
Year 3, Year 3,
Year 3,
Year 3,
Quarter Quarter Quarter Quarter Quarter Quarter
Quarter
Quarter
(ii)
8.
7
1
Year 1,
Year 1,
Year 1,
Year 1.
Year 2,
Year 2,
Year 2,
Year 2,
Year 3,
Quarter Quarter Quarter Quarter
Year 3,
Year 3,
Year 3,
Quarter Quarter Quarter Quarter Quarter Quarter Quarter Quarter
1
1
3
4
1
3
Time Period
(iii)
8
7
1
Year 1,
Year 2,
Year 2,
Year 2,
Year 3,
Year 3,
Year 1,
Quarter Quarter Quarter Quarter Quarter Quarter
Year 1,
Year 1,
Year 3,
Year 3,
Quarter Quarter Quarter Quarter Quarter Quarter
Year 2,
3
4
3
4
1
3
4
Time Period
Time Series Values
Time Series Values
Time Series Values
Expert Solution
This question has been solved!
Explore an expertly crafted, step-by-step solution for a thorough understanding of key concepts.

This is a popular solution!

Trending now
This is a popular solution!

Step by step
Solved in 2 steps with 3 images

Recommended textbooks for you
Advanced Engineering Mathematics
Advanced Math
ISBN:
9780470458365
Author:
Erwin Kreyszig
Publisher:
Wiley, John & Sons, Incorporated

Numerical Methods for Engineers
Advanced Math
ISBN:
9780073397924
Author:
Steven C. Chapra Dr., Raymond P. Canale
Publisher:
McGraw-Hill Education

Introductory Mathematics for Engineering Applicat…
Advanced Math
ISBN:
9781118141809
Author:
Nathan Klingbeil
Publisher:
WILEY
Advanced Engineering Mathematics
Advanced Math
ISBN:
9780470458365
Author:
Erwin Kreyszig
Publisher:
Wiley, John & Sons, Incorporated
Numerical Methods for Engineers
Advanced Math
ISBN:
9780073397924
Author:
Steven C. Chapra Dr., Raymond P. Canale
Publisher:
McGraw-Hill Education
Introductory Mathematics for Engineering Applicat…
Advanced Math
ISBN:
9781118141809
Author:
Nathan Klingbeil
Publisher:
WILEY

Mathematics For Machine Technology
Advanced Math
ISBN:
9781337798310
Author:
Peterson, John.
Publisher:
Cengage Learning,

