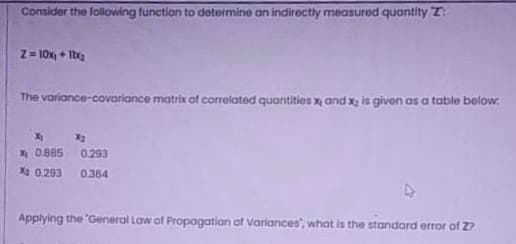
Consider the folowing function to determine an indirectly measured quantity T: Z= 10x, + Ibg The variance-covariance matrix of correlated quantities x and x is given as a tatble below: X2 x 0.885 0.293 Xa 0.293 0.364 Applying the "General Law of Propagation af variances", what is the standard error of Z?


Q: Refer to question (a). Find the mean of X and the variance covariance matrix of X, where X = (X1,…
A: The moment generating function(MGF) of a random variable defines the moments of a random variable.…
Q: Suppose that the bivariate random variable W = (W1,W2)™ has a Gaussian distribution on R² with zero…
A: Given that the bivariate random variable W=W1, W2T has a Gaussian distribution on ℝ2 with zero mean…
Q: Let X, Y, and Z be random variables, and let Cov(,) denote the covariance operator as usual. Suppose…
A: We want to find (1) Cov(11Y,4X)= ? (2)Cov(11Y+3, 4X+8Y)= ?
Q: In a trivariate distribution, if r12 0:7, r13 = 0.61 and r23 correlation coefficients. Also obtain…
A:
Q: 1. Suppose that Y; follows the Moving Average process of order 1 (MA(1)) model Y, = & – 0ɛt-1, where…
A: Haiyy
Q: The input voltage to a rectifier is the continuous uniform (-1, 1) random variable U. The rectifier…
A:
Q: Find (a) covariance (b) correlation coefficient of two random variables X and Y if E (X) = 2; E (Y)…
A: a) It is given that, E(X) = 2, E(Y) = 3, E(XY) = 10, E(X2) = 9 and E(Y2) = 16.
Q: 5. Given the residual vector v' = (0.10,0.06, 0.21,0.13,0.15), the weight matrix P =I, and degrees…
A: Given vector is, V^T=0.10,0.06,0.01,0.13,0.15 The weight matrix is P=I and d∘f=2 Since, V^T is 1×5…
Q: Find (a) Covariance and (b) Correlation coefficient of two random variables A and Y if E (X)= 2, E…
A:
Q: 1. Suppose that Y, follows the Moving Average process of order 1 (MA(1)) model Y₁ = Et -0t-1, where…
A: Given Yt follows the moving average process of order 1 . Yt=εt-θεt-1 where εtis independent and…
Q: 1. Suppose that Y, follows the Moving Average process of order 1 (MA(1)) model Y₁ = Et - 0&t-1,…
A:
Q: Let X1, X2, X3 and X4 be a random sample from population with pdf Sx, 0<x < 1 0, otherwise. fx (x) =…
A:
Q: If E denotes the expectation the variance of a random variable X is denoted as? a. (E(X))² O a. O b.…
A: Given,E denotes the expectation.
Q: Let X(t) and Y(t) be defined by X(t) = Acoswt + Bsinwt and Y(t) = Bcoswt – Asinwt %3D 3 where w is a…
A: # given two stochastic process X(t) & y(t) then to find cross correlation between x (t) and…
Q: 3. Consider the MA(2) model y, = E, + Bɛ,-2. where < 1 and (ɛ,) WN(0, 1). (a) Find the…
A: A Moving Averages MA(2) process takes the form (a) yt = εt+θεt-2 where θ <1 and {εt }…
Q: b. Find E[X(X – 1)] for Poisson random variable. Use the result to find the variance of X.
A:
Q: Consider a random sample Y1,Y2, ., Y, from a population with mean µ and variance ơ². Calculate the…
A: Given that Y1, Y2,....,Yn from a population with mean μ and variance σ2. M^=1197Y4+3Y5+7Y7+2Y19…
Q: Let XB and XA denote, respectively, the weight of a person before and after a certain weight loss…
A: (i) True Explanation : A t-test for two paired samples is a hypothesis test that attempts to make a…
Q: Prove that for the hinomial population with density function f (x, p) ="C, p`q" ¯ ', x = 1 , 2,...n.…
A:
Q: Let X be a discrete random variable with moment generating function 1 M(t) (e² + e=t) (e² + e³t +…
A:
Q: Let X, Y, and Z be random variables, and let Cov(-,;) denote the covariance operator as usual.…
A: GivenV(X)=0.7Cov(X,Y)=0.4Cov(X,Z)=1.2Cov(Y,Z)=0.8
Q: Let X be a discrete random variable with moment generating function 1 M(t) 6. (e²t + e=) (e²r + e³r…
A:
Q: and in correlation form all four variables have variance unity and all pairwise correlation…
A:
Q: For an AR(1) model with Y = 7.5, o = -0.6, µ= 5, and o? = 1, %3D %3D (a) Find Y(1), Ý(2), and Ý:(6).…
A:
Q: For the joint pdf of Exercise 30 in Chapter 4 (page 170): (a) Find the correlation coefficient of X…
A: (a). Determine the correlation coefficient of X and Y: The probability density function is given…
Q: Let X1, X2,...,X81 be i.i.d. (independent and identically distributed), each with expected value u =…
A: Provided information is, X1, X2, ...,X81 be independent identically distributed variables with…
Q: (a) Suppose that X1,..., X, are independent Laplace random variables, and let Y, = X1 + ……+ Xn. Find…
A: a) E[Yn]=E[X1+X2+....+Xn] =E[X1]+E[X2]+....+E[Xn] =0+0+........+0 =0…
Q: 1. Suppose that Y, follows the Moving Average process of order 1 (MA(1)) model Y₁ = &-0₁-1, where is…
A: Suppose Yt follows the moving average process of order 1 MA(1) model. Yt=εt-θεt-1 where εt is…
Q: You are conducting a test of independence for the claim that there is an association between the row…
A: In the given question from the information the observed data is - X Y Z Total A 41 26 30 97…
Q: Let X₁, X2, X3 be independent & identically distributed standard normal random variables and let Y₁…
A: Since you have posted questions with multiple sub-parts, we will solve the first three sub-parts for…
Q: Find the covariance and the correlation coefficient between X and Y, if X and Y are jointly discrete…
A: For the given data Find the covariance and correlation between x and y
Q: Given W = (aX + Y)2 where X and Y are zero-mean random variables with variance o2X =2, and variance…
A:
Q: Let X = [X1 X2 X3 X4], where the X; are all equal-mean unit-variance independent random variables.…
A: The complete solution is in given below
Q: Let X1, X2,...,X3 denote a random sample from a population having mean u and variance o2. 302 Which…
A:
Q: 1 1 0.48 0.02 Y 0.05 0.03 3 0.2 0.1 4 0.04 0.08 (a) Calculate P(X = 1|Y = 3). (b) Find the mode of…
A:
Q: Suppose that you have the following model and data to estimate the following equation Nobs Y X2…
A: The given data is Y X2 X3 1 1 3 2 2 2 4 4 5 3 3 4 2 5 1 We have to a. Find the OLS…
Q: Let X1,X2 denote the variables for the two-dimensional data in Exercise 1. Find a new variable yl of…
A:
Q: 12. Fill in the steps to show the bias/variance decomposition from HTF 2.25: Why does ET[(f(ro) –…
A:
Q: a) Find the expectation E (X) of X. E(X) = 0 (b) Find the variance VarX) of X. Var(X) = 0
A: Given: x P(x) 0 0.35 10 0.35 20 0.05 30 0.25 Total 1
Q: If the RVSX1, X2, ..., Xn all have the same variance s and he correlation oxil ficient between each…
A:
Q: Given f(x, y) = (x + 2y) ,0< x < 1,1 < y < 2 otherwise i. Compute the conditional mean of Y|X = =…
A: Given: The provided joint density function is:…
Q: Consider the one-way analysis of variance model Xij = µ + a; + Eij, i= 1,.., m, j= 1,..., ni, where…
A:
Q: (Yj, Xqj, X2i) satisfy the following assumptions ; in addition, var(u,X1j, X2i) =3 and var (Xi) = 4.…
A: From the given information, varui|X1i,X2i=3⇒σu2=3VarX1i=4⇒σX12=4n=397 Formula:…
Q: Identify the distributions of the random variables with the following moment- generating functions…
A:
Q: a. Given the iid sample (y1, r1),..., (yN, IN), derive the maximum likelihood estimator of Bo and…
A:
Q: Given the pdf of X GEOM(p) S(1 – p)=-'p, if x = 1, 2, 3, ., ∞ f(r) = 0, otherwise Derive the…
A: Note: Hey, since there are multiple subparts are posted, we will answer first three subparts for…
Q: 6. Use Itô isometry to calculate the variance of each of the following: (a) f etW (t) dW(t), where 0…
A: Given: Let us consider the given and compute the variance, a) ∫abetWt dWt, where 0≤a<b<∞; b)…
Q: Exercise 3. For an i.i.d. sample of n = 2m + 1 observations of a U(0, 1) random variable, show that…
A: Given an iid sample of n=2m+1 observations of a U0,1 random variable.
Q: Suppose that, as in Exercises 5.11 and 5.79, Y1 and Y2 are uniformly distributed over the triangle…
A: The given diagram is, Therefore, from this diagram, The point are, (0,1),(-1,0),(1,0) i.e.…
Q: Consider R.V. Y Unif (0, 1) What is the variance of U -4 In(Y)? %D
A: From the given information, Y~Unif0,1. f(y)=11-0 =1, 0<y<1

Step by step
Solved in 3 steps

- From the data of the following table: Calculate Spearman's rank correlation coefficient between x and y and determine its type. sSuppose that the index model for two Canadian stocks HD and ML is estimated with the following results: RHD =-0.03+2.10RM+eHD R-squared =0.7 RML =0.06+1.60RM+eML R-squared =0.6 σM =0.15 where M is S&P/TSX Comp Index and RX is the excess return of stock X. What is the covariance and the correlation coefficient between HD and ML?A snack food manufacturer estimates that the variance of the number of grams of carbohydrates in servings of its tortilla chips is 1.34. A dietician is asked to test this claim and finds that a random sample of 16 servings has a variance of 1.22. At α=0.05, is there enough evidence to reject the manufacturer's claim? Assume the population is normally distributed. Complete parts (a) through (e) below.
- Note- bolded quiz have already answered A possible important environmental determinant of lung function in children is the amount of cigarette smoking in the home. Suppose this question is studied by selecting two groups: Group 1 consists of 23 nonsmoking children 5-9 years of age, both of whose parents smoke, who have a mean forced expiratory volume (FEV) of 2.1 L and a standard deviation of 0.7 L; group 2 consists of 20 nonsmoking children of comparable age, neither of whose parents smoke, who have a mean FEV of 2.3 L and a standard deviation of 0.4 L.*8.31 What are the appropriate null and alternative hypotheses to compare the means of the two groups? *8.32 What is the appropriate test procedure for the hypotheses in Problem 8.31? *8.33 Carry out the test in Problem 8.32 using the criticalvalue method. *8.34 Provide a 95% CI for the true mean difference in FEV between 5- to 9-year-old children whose parents smoke and comparable children whose parents do not smoke. *8.35 Assuming…Refer to Exercise 8.S.6. Analyze these data using a Wilcoxon signed-rank test.If the value of Cronbach’s alpha is 0.07, it means ___________; a. Research instrument is not reliable b. Research instrument is internally consistent c. Data is reliable d. Data is internally consistent
- The National Safety Council of the U.S. released the following data on the incidence rates for fatal or lost-worktime injuries per 100 employees for several industries in three recent years. Compute r for each pair of years and determine which years are most highly correlated. Calculate r using 1. the formula and 2. function. Industry Year 1 Year 2 Year 3 Textile 0.46 0.48 0.69 Chemical 0.52 0.62 0.63 Communication 0.9 0.72 0.81 Machinery 1.5 1.74 2.1 Services 2.89 2.03 2.46 Nonferrous metals 1.8 1.92 2 Food 3.29 3.18 3.17 Government 5.73 4.43 4 By formula By Function By formula By Function r1 r2 r3 Please provide a step by step of calculation in excelto give me an understaning on how to calculate in future Thank you in advance1. Calculate the Variance for each lake 2. Plug values into the t-test equation and find 'calculated t' 3. Determine the df and look up 'critical t' with a p-value of 0.05A possible important environmental determinant of lung function in children is the amount of cigarette smoking in the home. Suppose this question is studied by selecting two groups: Group 1 consists of 23 nonsmoking children 5-9 years of age, both of whose parents smoke, who have a mean forced expiratory volume (FEV) of 2.1 L and a standard deviation of 0.7 L; group 2 consists of 20 nonsmoking children of comparable age, neither of whose parents smoke, who have a mean FEV of 2.3 L and a standard deviation of 0.4 L.*8.31 What are the appropriate null and alternative hypotheses to compare the means of the two groups? *8.32 What is the appropriate test procedure for the hypotheses in Problem 8.31? *8.33 Carry out the test in Problem 8.32 using the criticalvalue method. *8.34 Provide a 95% CI for the true mean difference in FEV between 5- to 9-year-old children whose parents smoke and comparable children whose parents do not smoke. *8.35 Assuming this is regarded as a pilot study, how many…
- b. Find the linear correlation coefficient, r, then determine whether there is sufficient evidence to support the claim of a linear correlation between the two variables.Suppose that the index model for two Canadian stocks HD and ML is estimated with the following results: RHD =-0.03+2.10RM+eHD R-squared =0.7 RML =0.06+1.60RM+eML R-squared =0.6 σM =0.15 where M is S&P/TSX Comp Index and RX is the excess return of stock X. What is the covariance and the correlation coefficient between HD and ML? For portfolio P with investment proportion of 0.4 in HD and 0.6 in ML, calculate the systematic risk, non-systematic risk, and total risk of P.A snack food manufacturer estimates that the variance of the number of grams of carbohydrates in servings of its tortilla chips is 1.141.14. A dietician is asked to test this claim and finds that a random sample of 2424 servings has a variance of 0.950.95. At alpha equals 0.10α=0.10, is there enough evidence to reject the manufacturer's claim? Assume the population is normally distributed.