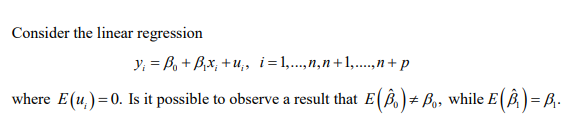
Consider the linear regression y; = Bo + B,x, +u, i= 1,..,n,n+1,.,n+ p where E(u,) =0. Is it possible to observe a result that E( )# Bo, while E( B,)= B.-


Q: In exercise 1, the following estimated regression equation based on 10 observations was presented.…
A: “Since you have asked multiple questions, we will solve the first question for you. If you want any…
Q: Company A wants to forecast future demand using the time series forecasting technique. The analyst…
A: The method is demand forecasting. It's used to forecast and estimate a product's or service's future…
Q: A researcher has estimated the relationship between salaries of 100 selected employees of an…
A: A. Let the intercept be denoted by B0 Step 1: Form Null and Alternative Hypothesis Null Hypothesis :…
Q: Economics Four hundred driver's license applicants were randomly selected and asked whether they…
A: * solution :- (1)
Q: Past class data has shown that the regression line relating the final exam score and the midterm…
A: The regression line defines how the variables depend on each other. A standard regression line…
Q: We estimate econometric models O A. based on our believes about the relationship among variables. B.…
A: Econometric models get used for studying the statistical relationships relevant to economic…
Q: In regression analysis, the existence of a significant pattern in successive values of the error…
A: Regression analysis uses various statistical tools and processes in order to estimate the…
Q: You are given the following regression results: Qt = 30.5 + 0.78L; N= 15 R2 = 0.65 DW = 3.03…
A: We are going to use Durbin Watson table for 1% significance level to answer this question.
Q: Four hundred driver's license applicants were randomly selected and asked whether they passed their…
A:
Q: X2 X3 X4 12 2. 13 3. 7. 2. 6. 7. 23.2 13 13 15 2. 12 15 11 17 2. In Table 1. you have data for…
A: Gauss Markov Theorem states a set of assumptions, which ensures the linear regression model…
Q: 8. Which of the following best describes the linear probability model? The model is the application…
A: When talking about regression model, there are numerous forms of a regression to estimate the…
Q: Distance tô Work (miles) Select your answer - Does a linear relationship appear reasonable? - Select…
A: a. On making a scatterplot with the given data, we get something like this This is not a linear…
Q: Consider the simple regression model Yi = B2x1 + & Find the least squares estimator b, and show Eŷ,…
A:
Q: 6. The following two regression models are Probit and Logit respectively: P(Y-112)-(B+B₁ × X₁ +₂×…
A: Given function Pr(Y=1|X)=ϕ(β0+β1X1+β2X2)---Probit modelPr(Y=1|X)=F(β0+β1X1+β2X2)---Logit model
Q: For the regression Y = B0+B1X+u, the variance u is conditional homoskedastic. Is it correct if you…
A: Solution: The concept of regression models, the errors of a regression model, the assumptions of…
Q: Solncy variables in x and a previous value of y; see Example 4.4. a. For estimating B, why do we…
A:
Q: a 95% confidence interval for B1, the regression slope coefficient. confidence interval for B1, the…
A:
Q: Suppose that a researcher, using data on class size (CS) and average test scores from 100…
A: Since you have posted multiple subparts, as per the guideline we are allowed to solve 1st question…
Q: Given the following regression output, Predictor Coefficient SE Coefficient t p-value…
A: The model estimated is a multiple linear regression model with an intercept and x1 and x2 as…
Q: c) A sample of 20 observations was divided into two equal sets after arranging for the independent…
A: Given Information: Set 1: y^=1.053+0.8760xResidual sum of squares = 3.8128Sample size (n1)=10…
Q: he mean squared error of a regression is: Equal to R². O Equal to Adjusted R?. O A measure of fit. O…
A: The mean squared error of a regression is : Equal to R2.
Q: Select your answer - v b. What does the scatter diagram developed in part (a) indicate about the…
A: (b) Determine the type of relationship exists between the two variables. From the scatter plot…
Q: Given the regression equationY = 43 + 10Xa. What is the change in Y when X changes by +8?b. What is…
A: Hi! Thank you for the question but as per the guidelines, we answer only 3 subparts at a time.…
Q: 1.In econometrics, a sample is Select one: a. the entire group of entities that we are interested…
A: Since you have posted multiple questions so as per answering guideline, we will solve first…
Q: Perform a linear regression that relates bar sales to guests (not to time). b) If the forecast is…
A: A linear regression is a statistical and mathematical concept which helps to study the relationship…
Q: Given the regression equationY = -50 + 12Xa. What is the change in Y when X changes by +3?b. What is…
A: Since we only answer up to 3 sub-parts, we’ll answer the first 3. Please resubmit the question and…
Q: The following data are given based on 10 pairs of observations on Y and X. Given the population…
A:
Q: Describe the important characteristics of the variance of a conditional distribution of an error…
A: Linear regression is a technique that is used to predict the value of one dependent variable Y (the…
Q: QUESTION 8 Having many relevant instruments: O a. is good because they provide more information. Ob.…
A: Answer - Need to find- Having many relevant instruments Evaluating the options:- A. Is good…
Q: In the multiple regression model, the assumption of no perfect collinearity is best described as:…
A: "Since you have asked multiple questions, we will solve first question for you .. If you want any…
Q: Consider an ISLM model given by these equations: Y = C + I + G C = 10 + Ya T = 10 G = 15 I = 5+÷Y –…
A: (a) At equilibrium Y = C + I + G => Y = 10 + (1/2)Yd + 5 + (1/4)y -100i + 15 Note: Yd = Y - T…
Q: The simple linear regression model in the exhibit 2 data shows that, Both the intercept and the IDV…
A: "Since you have asked multiple questions, we will solve the first question for you. If you want any…
Q: A researcher estimates a regression using two different software packages.The first uses the…
A: The regression is a method of finding the mathematical relationship between the dependent and…
Q: You have noticed that paying higher wages attracts more productive employees. However, you are…
A: In the labor market, the market forces of demand and supply of labor determine the equilibrium wage…
Q: You estimate the following regression: In(Earn) = 5.349 + 0.0159*Education (2.755) (0.0092) What is…
A: In statistics, a confidence interval is the interval of probability that a population parameter will…
Q: he following data gives the experience of the machine operators and their performance ratings as…
A: Experience(X) Performance rating(Y) 16 88 12 87 18 89 4 68 3 78 10 80 5 75 12 83
Q: The measure of standard error can also be applied to the parameter estimates resulting from linear…
A: A statistic's standard error is the standard deviation of its sample distribution or an…
Q: This exercise refers to the drunk driving panel data regression, summarizedin Regression analysis of…
A: "Since you have posted a question with multiple sub-parts, we will solve first three sub-parts for…
Q: When running a ols regression, if my control variables are insignificant via T-test should I keep…
A: To determine whether to keep insignificant variables in the regression or not.
Q: True or False? WLS is preferred to OLS when an important variable has been omitted from the model.
A: The given statement is false.
Q: A marketing analyst wants to examine the relationship between sales (in $1,000s) and advertising (in…
A: We have model of sale and advertising where sale is dependent on advertising.
Q: The yield of a grain, Y (/ha), appears to be linearly related to the amount of fertilizer applied, X…
A: Since you have asked multiple question, we will solve the first question for you. If you want any…
Q: QUESTION 8 Having many relevant instruments: a. is good because they provide more information. D. is…
A: When making economic analysis, various aspects are considered for an effective regression model.
Q: Finally consider the regression model with an extra covariate: Yi = Bo + B1.x 1i + B2x2; + €; Let…
A: Given information yi=β0+β1x1i+β2x2iβ2^=3.13s.e β2^=1.12n=811
Q: When Y is regressed on X, B, > 0, sx# 0, sy# 0, and the fraction of the variation in Y explained by…
A: Note:- “Since you have asked multiple question, we will solve the first question for you. If you…
Q: With Panel Data, if we assume that the individual effects vi are not correlated with the regressors…
A: When making an economic analysis using the OLS estimator, many variables are correlated with each…
Q: Distinguish between the R2 and the standard error of a regression. How doeach of these measures…
A: In regression analysis, R2 and standard error are the major goodness of fit measures. Coefficient of…
Q: Construct a 95% confidence interval for the average value of y for the following data. Use x = 25,…
A:
Q: 1. If in a simple linear regression, SST = 315 and the sample correlation coefficient between your…
A: When talking abou linear regression model, there are different methods to determine sample…
Q: For the estimated regression equation ŷ= 15 + 6x1 + 5x2 + 4x1X2, a unit increase in x2, while…
A: Here, we calculate the given for the estimated regression equation by the following method given…
could you please solve my question? :)

Step by step
Solved in 2 steps


- Given the regression equationY = -50 + 12Xa. What is the change in Y when X changes by +3?b. What is the change in Y when X changes by -4?c. What is the predicted value of Y when X = 12?d. What is the predicted value of Y when X = 23?e. Does this equation prove that a change in X causes a change in Y?The following data gives the experience of the machine operators and their performance ratings as given by the number of good parts turned out per 100 pieces.Experience(X) 16 12 18 4 3 10 5 12Performance Ratings (Y) 88 87 89 68 78 80 75 83Obtain the regression line of performance ratings on experience and estimate the probable performance if the operator has 7 years of experience.In the December, 1969, American Economic Review (pp. 886-896), Nathanial Leff reports thefollowing least squares regression results for a cross section study of the effect of age composition onsavings in 74 countries in 1964:log S/Y = 7.3439 + 0.1596 log Y/N + 0.0254 log G - 1.3520 log D1 - 0.3990 log D2 (R2= 0.57)log S/N = 8.7851 + 1.1486 log Y/N + 0.0265 log G - 1.3438 log D1 - 0.3966 log D2 (R2= 0.96)where S/Y = domestic savings ratio, S/N = per capita savings, Y/N = per capita income, D1 = percentage ofthe population under 15, D2 = percentage of the population over 64, and G = growth rate of per capitaincome. Are these results correct? Explain..
- DEPENDENT VARIABLE Qc R- SQUARE P- VALUE ON F 64 0.8093 0.0001 INDEPENDENTVARIABLE PARAMETER ESTIMATE STANDARD ERROR T-RATIO P-VALUE INTERCEPT 8.20 4.01 2.04 0.0461 PC -3.54 1.64 -2.16 0.0357 M 0.64287 0.19 3.38 0.0014 PA 0.7854 0.38 2.07 0.0439 10. Write the resulting regression equation. Q = f( P, M, PR) where Qc = demand for cement/month (in yards) Pc = the price of cement per yard, M = country’s tax revenues per capita, and PR = the price of asphalt per yard.Given the regression equationY = 43 + 10Xa. What is the change in Y when X changes by +8?b. What is the change in Y when X changes by -6?c. What is the predicted value of Y when X = 11? d. What is the predicted value of Y when X = 29? e. Does this equation prove that a change in X causes a change in Y?No written by hand solution Consider the following data: x⎯⎯x¯ = 20, sx = 2, y⎯⎯y¯ = −5, sy = 4, and b1 = 0.40. Which of the following is the sample regression equation? Multiple Choice yˆ = −13 − 0.40x yˆ= −13 + 0.40x yˆ = 3 − 0.40x yˆ = 3 + 0.40x
- In exercise 1, the following estimated regression equation based on 10 observations was presented. y^=29.1270+.5906x1+.4980x2Here SST=6724.125, SSR=6216.375, sb1=.0813, and sb2=.0567. a) Compute MSR and MSE. b) Compute F and perform the appropriate F test. Use α=.05. c) Perform a t test for the significance of β1. Use α=.05. d) Perform a t test for the significance of β2. Use α=.05.You estimated a regression with the following output. Source | SS df MS Number of obs = 472-------------+---------------------------------- F(1, 470) > 99999.00 Model | 2.2728e+09 1 2.2728e+09 Prob > F = 0.0000 Residual | 4246681.85 470 9035.4933 R-squared = 0.9981-------------+---------------------------------- Adj R-squared = 0.9981 Total | 2.2771e+09 471 4834590.83 Root MSE = 95.055------------------------------------------------------------------------------ Y | Coef. Std. Err. t P>|t| [95% Conf. Interval]-------------+---------------------------------------------------------------- X | 29.84419 .0595046 501.54 0.000 29.72726 29.96112 _cons | 88.27799 7.592427 11.63 0.000 73.35868 103.1973------------------------------------------------------------------------------…1. R-squaredSuppose regression of y on an intercept and x with 50 observations yields total sum of squares 100 andexplained sum of squares 36.(a) What is ?^2?(b) What is the correlation coefficient between y and x?(c) What is the standard error of the residual?
- a simple linear regression equation shows the relationship between-As a manager of a small software retailing company, you are concerned with projected profit next year. While profit can be determined as the difference between sales and maintenance cost, or in symbols, P = S - M, where P is profit, S is sales, and M is maintenance cost including technical support. It is argues that when sales goes up so does maintenance cost because the cost of technical support will go up. Further, it is measured that the correlation between S and M is 0.8. Now given the figure that sales next year is expected to be $300 thousand with standard deviation of $4 thousand and maintenance cost is expected to be $150 thousand with standard deviation of $6 thousand, what would be the expected profit and its standard deviation you will include in your report?The owner of a movie theater company used multiple regression analysis to predict gross revenue (y) as a function of television advertising (x1) and newspaper advertising (x2). The estimated regression equation was ŷ = 83.7 + 2.23x1 + 1.60x2. The computer solution, based on a sample of eight weeks, provided SST = 25.4 and SSR = 23.445. (a)Compute and interpret R2 and Ra2.(Round your answers to three decimal places.) The proportion of the variability in the dependent variable that can be explained by the estimated multiple regression equation is (??) . Adjusting for the number of independent variables in the model, the proportion of the variability in the dependent variable that can be explained by the estimated multiple regression equation is (??).