The following graph shows the labor market in the fast-food industry in the fictional town of Supersize City. In a labor market, workers supply their labor to the market in exchange for wages, and their behavior is represented by the supply curve. Similarly, firms pay wages to obtain labor, and thus their behavior is represented by the demand curve. In this way, wages are the price of labor. In this market, the equilibrium hourly wage is $_________, and the equilibrium quantity of labor is _________ thousand workers. Suppose a senator introduces a bill to legislate a minimum hourly wage of $6. This type of price control is called a _________ (options: quota, price ceiling, tax, price floor).


The following graph shows the labor market in the fast-food industry in the fictional town of Supersize City. In a labor market, workers supply their labor to the market in exchange for wages, and their behavior is represented by the supply curve. Similarly, firms pay wages to obtain labor, and thus their behavior is represented by the
In this
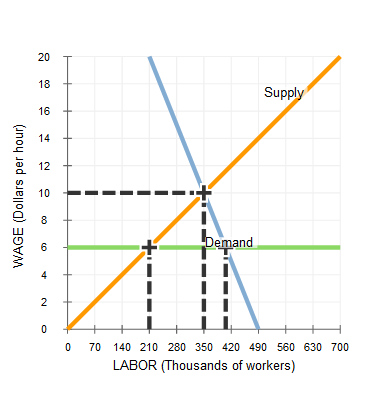
The demand for labor refers to the total amount of labor which the firms want to hire at the given wage rate. The supply of labor on the other hand is the total amount of labor which people want to supply at the given wage rate. The higher level of labor is supplied at higher wage rate, but lower labor is demanded at higher wage rate.

Trending now
This is a popular solution!

Step by step
Solved in 3 steps


