Consider the market for pens. Suppose that new research has been published stating that the process of writing, erasing, and rewriting improves memorization, leading parents to avoid giving their children pens in favor of pencils. Further, the price of plastic, a major input in the pen production process, has dropped sharply. On the following graph, labeled Scenario 1, indicate the effect these two events have on the demand for and supply of pens. Note: Select and drag one or both of the curves to the desired position. Curves will snap into position, so if you try to move a curve and it snaps back to its original position, just drag it a little farther. image 1 image 2 Compare both the Scenario 1 and Scenario 2 graphs. Notice that after completing both graphs, you can now see a difference between them that wasn't apparent before the shifts because each graph indicates different magnitudes for the supply and demand shifts in the market for pens. Use the results of your answers on both the Scenario 1 and Scenario 2 graphs to complete the following table. Begin by indicating the overall change in the equilibrium price and quantity after the shift in demand or supply for each shift-magnitude scenario. Then, in the final column, indicate the resulting change in the equilibrium price and quantity when supply and demand shift in the direction you previously indicated on both graphs. If you cannot determine the answer without knowing the magnitude of the shifts, choose Cannot determine
Consider the market for pens. Suppose that new research has been published stating that the process of writing, erasing, and rewriting improves memorization, leading parents to avoid giving their children pens in favor of pencils. Further, the price of plastic, a major input in the pen production process, has dropped sharply. On the following graph, labeled Scenario 1, indicate the effect these two events have on the demand for and supply of pens. Note: Select and drag one or both of the curves to the desired position. Curves will snap into position, so if you try to move a curve and it snaps back to its original position, just drag it a little farther. image 1 image 2 Compare both the Scenario 1 and Scenario 2 graphs. Notice that after completing both graphs, you can now see a difference between them that wasn't apparent before the shifts because each graph indicates different magnitudes for the supply and demand shifts in the market for pens. Use the results of your answers on both the Scenario 1 and Scenario 2 graphs to complete the following table. Begin by indicating the overall change in the equilibrium price and quantity after the shift in demand or supply for each shift-magnitude scenario. Then, in the final column, indicate the resulting change in the equilibrium price and quantity when supply and demand shift in the direction you previously indicated on both graphs. If you cannot determine the answer without knowing the magnitude of the shifts, choose Cannot determine

Principles of Economics 2e
2nd Edition
ISBN:9781947172364
Author:Steven A. Greenlaw; David Shapiro
Publisher:Steven A. Greenlaw; David Shapiro
Chapter3: Demand And Supply
Section: Chapter Questions
Problem 3SCQ: In an analysis of the market for paint, an economist discovers the facts listed below. State whether...

Related questions
Question
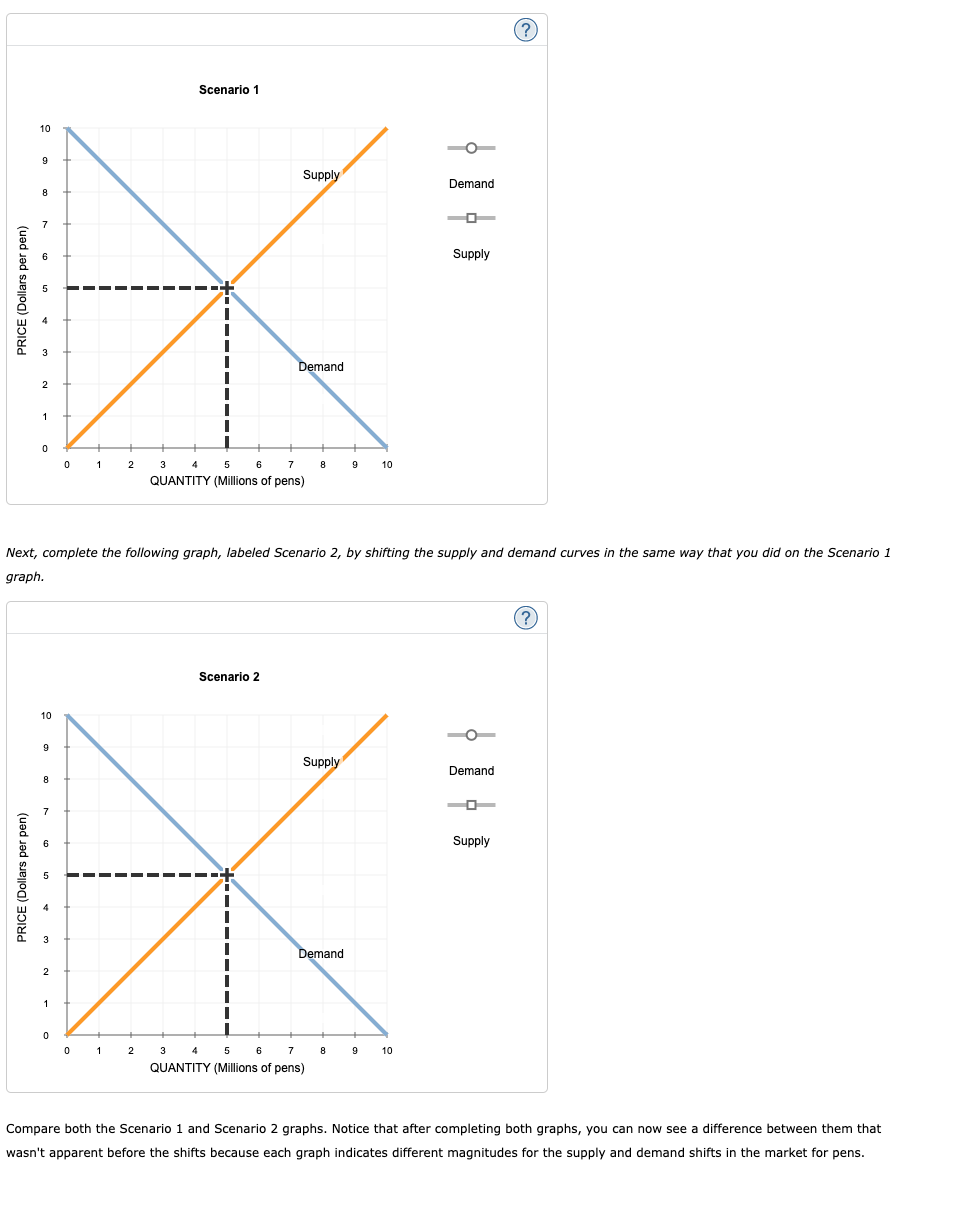
Consider the market for pens. Suppose that new research has been published stating that the process of writing, erasing, and rewriting improves memorization, leading parents to avoid giving their children pens in favor of pencils. Further, the price of plastic, a major input in the pen production process, has dropped sharply.
On the following graph, labeled Scenario 1, indicate the effect these two events have on the demand for and supply of pens.
Note: Select and drag one or both of the curves to the desired position. Curves will snap into position, so if you try to move a curve and it snaps back to its original position, just drag it a little farther.
image 1
image 2
Compare both the Scenario 1 and Scenario 2 graphs. Notice that after completing both graphs, you can now see a difference between them that wasn't apparent before the shifts because each graph indicates different magnitudes for the supply and demand shifts in the market for pens.
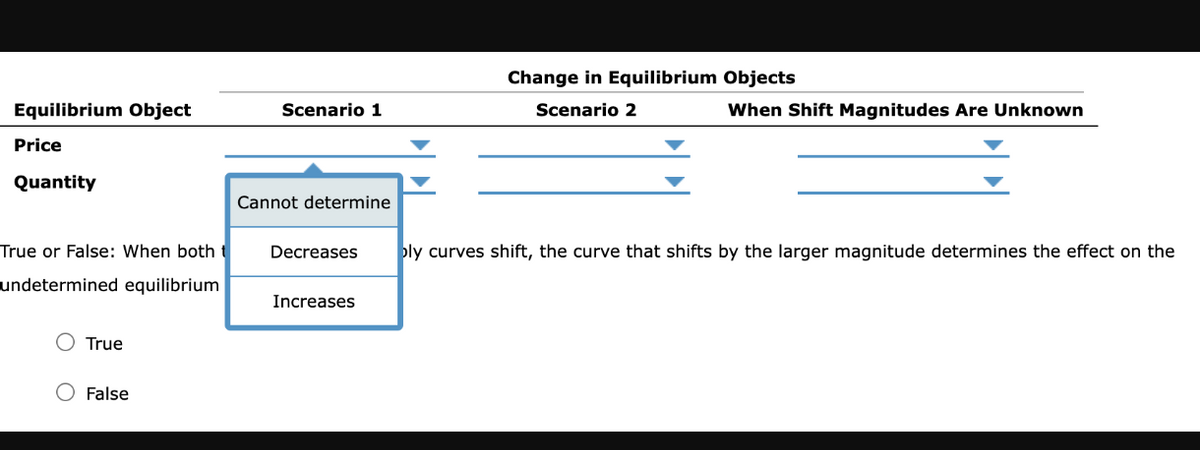
Use the results of your answers on both the Scenario 1 and Scenario 2 graphs to complete the following table. Begin by indicating the overall change in the equilibrium price and quantity after the shift in demand or supply for each shift-magnitude scenario. Then, in the final column, indicate the resulting change in the equilibrium price and quantity when supply and demand shift in the direction you previously indicated on both graphs. If you cannot determine the answer without knowing the magnitude of the shifts, choose Cannot determine.
Transcribed Image Text:PRICE (Dollars per pen)
10
PRICE (Dollars per pen)
9
8
3
2
1
0
10
9
8
7
3
2
1
0 1
0
2
Scenario 1
Next, complete the following graph, labeled Scenario 2, by shifting the supply and demand curves in the same way that you did on the Scenario 1
graph.
Supply
3
4
5
6
7
QUANTITY (Millions of pens)
Scenario 2
Demand
0 1 2 3 4 5 6
8
Supply
7
QUANTITY (Millions of pens)
Demand
9
10
Demand
8 9 10
Supply
Demand
?
Supply
(?)
Compare both the Scenario 1 and Scenario 2 graphs. Notice that after completing both graphs, you can now see a difference between them that
wasn't apparent before the shifts because each graph indicates different magnitudes for the supply and demand shifts in the market for pens.
Transcribed Image Text:Equilibrium Object
Price
Quantity
True or False: When both t
undetermined equilibrium
True
O False
Scenario 1
Cannot determine
Change in Equilibrium Objects
Scenario 2
Increases
When Shift Magnitudes Are Unknown
Decreases bly curves shift, the curve that shifts by the larger magnitude determines the effect on the
Expert Solution
This question has been solved!
Explore an expertly crafted, step-by-step solution for a thorough understanding of key concepts.

This is a popular solution!

Trending now
This is a popular solution!

Step by step
Solved in 4 steps with 4 images

Knowledge Booster


Learn more about
Need a deep-dive on the concept behind this application? Look no further. Learn more about this topic, economics and related others by exploring similar questions and additional content below.Recommended textbooks for you
Principles of Economics 2e
Economics
ISBN:
9781947172364
Author:
Steven A. Greenlaw; David Shapiro
Publisher:
OpenStax

Microeconomics: Principles & Policy
Economics
ISBN:
9781337794992
Author:
William J. Baumol, Alan S. Blinder, John L. Solow
Publisher:
Cengage Learning

Principles of Economics 2e
Economics
ISBN:
9781947172364
Author:
Steven A. Greenlaw; David Shapiro
Publisher:
OpenStax
Microeconomics: Principles & Policy
Economics
ISBN:
9781337794992
Author:
William J. Baumol, Alan S. Blinder, John L. Solow
Publisher:
Cengage Learning


Economics (MindTap Course List)
Economics
ISBN:
9781337617383
Author:
Roger A. Arnold
Publisher:
Cengage Learning
