Consider the traffic flow described by the following diagram. The letters A through D label intersections. The data was obtained by counting the number of vehicles that travelled around the four one-way streets between the hours of 6 am to 10 pm, and 2 pm to 6 pm during the mid-week peak traffic hours. The arrows in the diagram indicate the direction of flow of traffic in and out of the network that is measured in terms of number of vehicles per hour (vph) %23 150 220 B 70 180 A X4 185 C D 130 115 400 a) Write the system of linear equation for each of the intersection. b) Use Gauss-Jordan elimination to solve the system. c) Which intersection shows the greatest flow? How can we reduce the flow at the intersection?
Consider the traffic flow described by the following diagram. The letters A through D label intersections. The data was obtained by counting the number of vehicles that travelled around the four one-way streets between the hours of 6 am to 10 pm, and 2 pm to 6 pm during the mid-week peak traffic hours. The arrows in the diagram indicate the direction of flow of traffic in and out of the network that is measured in terms of number of vehicles per hour (vph) %23 150 220 B 70 180 A X4 185 C D 130 115 400 a) Write the system of linear equation for each of the intersection. b) Use Gauss-Jordan elimination to solve the system. c) Which intersection shows the greatest flow? How can we reduce the flow at the intersection?

Algebra & Trigonometry with Analytic Geometry
13th Edition
ISBN:9781133382119
Author:Swokowski
Publisher:Swokowski
Chapter3: Functions And Graphs
Section3.5: Graphs Of Functions
Problem 81E

Related questions
Question
Transcribed Image Text:Traffic Network
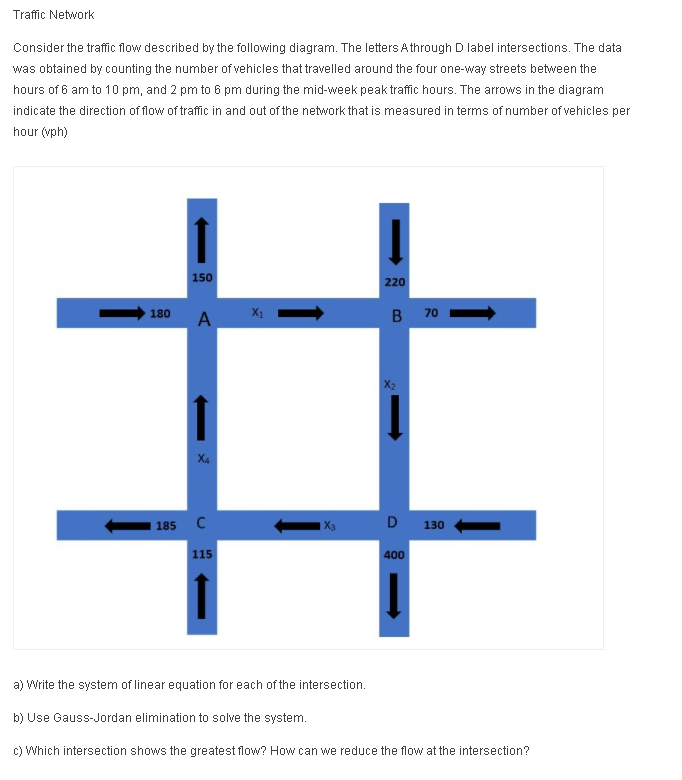
Consider the traffic flow described by the following diagram. The letters Athrough D label intersections. The data
was obtained by counting the number of vehicles that travelled around the four one-way streets between the
hours of 6 am to 10 pm, and 2 pm to 6 pm during the mid-week peak traffic hours. The arrows in the diagram
indicate the direction of flow of traffic in and out of the network that is measured in terms of number of vehicles per
hour (vph)
%23
150
220
B 70
180
X1
A
X4
185 C
D 130
115
400
a) Write the system of linear equation for each of the intersection.
b) Use Gauss-Jordan elimination to solve the system.
c) Which intersection shows the greatest flow? How can we reduce the flow at the intersection?
Expert Solution
This question has been solved!
Explore an expertly crafted, step-by-step solution for a thorough understanding of key concepts.

This is a popular solution!

Trending now
This is a popular solution!

Step by step
Solved in 3 steps with 1 images

Recommended textbooks for you
Algebra & Trigonometry with Analytic Geometry
Algebra
ISBN:
9781133382119
Author:
Swokowski
Publisher:
Cengage


Trigonometry (MindTap Course List)
Trigonometry
ISBN:
9781337278461
Author:
Ron Larson
Publisher:
Cengage Learning
Algebra & Trigonometry with Analytic Geometry
Algebra
ISBN:
9781133382119
Author:
Swokowski
Publisher:
Cengage
Trigonometry (MindTap Course List)
Trigonometry
ISBN:
9781337278461
Author:
Ron Larson
Publisher:
Cengage Learning

Glencoe Algebra 1, Student Edition, 9780079039897…
Algebra
ISBN:
9780079039897
Author:
Carter
Publisher:
McGraw Hill