Could you explain how to find the last question which talks about proportion?

College Algebra (MindTap Course List)
12th Edition
ISBN:9781305652231
Author:R. David Gustafson, Jeff Hughes
Publisher:R. David Gustafson, Jeff Hughes
Chapter8: Sequences, Series, And Probability
Section8.CR: Chapter Review
Problem 37E: Find the positive geometric mean between 4 and 64.

Related questions
Question
Could you explain how to find the last question which talks about proportion?
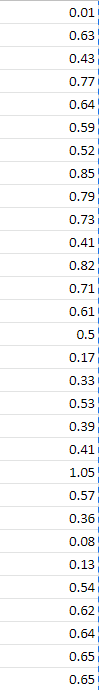
Transcribed Image Text:0.01
0.63
0.43
0.77
0.64
0.59
0.52
0.85
0.79
0.73
0.41
0.82
0.71
0.61
0.5
0.17
0.33
0.53
0.39
0.41
1.05
0.57
0.36
0.08
0.13
0.54
0.62
0.64
0.65
0.65
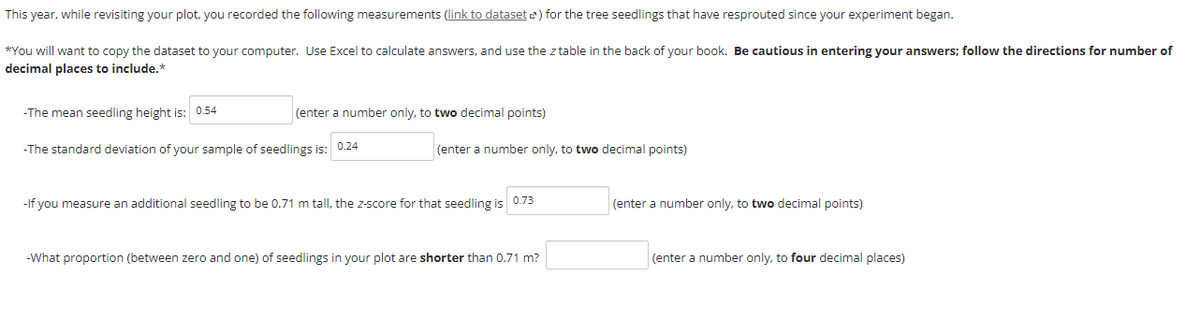
Transcribed Image Text:This year, while revisiting your plot, you recorded the following measurements (link to dataset ) for the tree seedlings that have resprouted since your experiment began.
*You will want to copy the dataset to your computer. Use Excel to calculate answers, and use the z table in the back of your book. Be cautious in entering your answers; follow the directions for number of
decimal places to include.*
-The mean seedling height is: 0.54
(enter a number only, to two decimal points)
-The standard deviation of your sample of seedlings is: 0.24
(enter a number only, to two decimal points)
0.73
-If you measure an additional seedling to be 0.71 m tall, the z-score for that seedling is
-What proportion (between zero and one) of seedlings in your plot are shorter than 0.71 m?
(enter a number only, to two decimal points)
(enter a number only, to four decimal places)
Expert Solution
This question has been solved!
Explore an expertly crafted, step-by-step solution for a thorough understanding of key concepts.

This is a popular solution!

Trending now
This is a popular solution!

Step by step
Solved in 2 steps with 1 images

Recommended textbooks for you
College Algebra (MindTap Course List)
Algebra
ISBN:
9781305652231
Author:
R. David Gustafson, Jeff Hughes
Publisher:
Cengage Learning
College Algebra (MindTap Course List)
Algebra
ISBN:
9781305652231
Author:
R. David Gustafson, Jeff Hughes
Publisher:
Cengage Learning