Create a concept map to demonstrate the relationships between carbohydrate, protein and lipid catabolism. Start the chart by mapping out (in detail) the steps of carbohydrate catabolism and then lipid and protein. Include the products produced during various steps and how they might feed into other parts of the other catabolisms. For example, glycerol phosphate from phospholipids could be used during glycolysis to produce pyruvate.
Create a concept map to demonstrate the relationships between carbohydrate, protein and lipid catabolism. Start the chart by mapping out (in detail) the steps of carbohydrate catabolism and then lipid and protein. Include the products produced during various steps and how they might feed into other parts of the other catabolisms. For example, glycerol phosphate from phospholipids could be used during glycolysis to produce pyruvate.
Understanding Nutrition (MindTap Course List)
15th Edition
ISBN:9781337392693
Author:Eleanor Noss Whitney, Sharon Rady Rolfes
Publisher:Eleanor Noss Whitney, Sharon Rady Rolfes
Chapter5: The Lipids: Triglycerides, Phospholipids, And Sterols
Section5.6: Health Effects And Recommended Intakes Of Monounsaturated And Polyunsaturated Fats
Problem 5.2TI

Related questions
Question
Can I get a good drawn out example of a concept map? Instructions are provided in the photo attached. Read first paragraph.
Transcribed Image Text:Submission & Rubric
Description
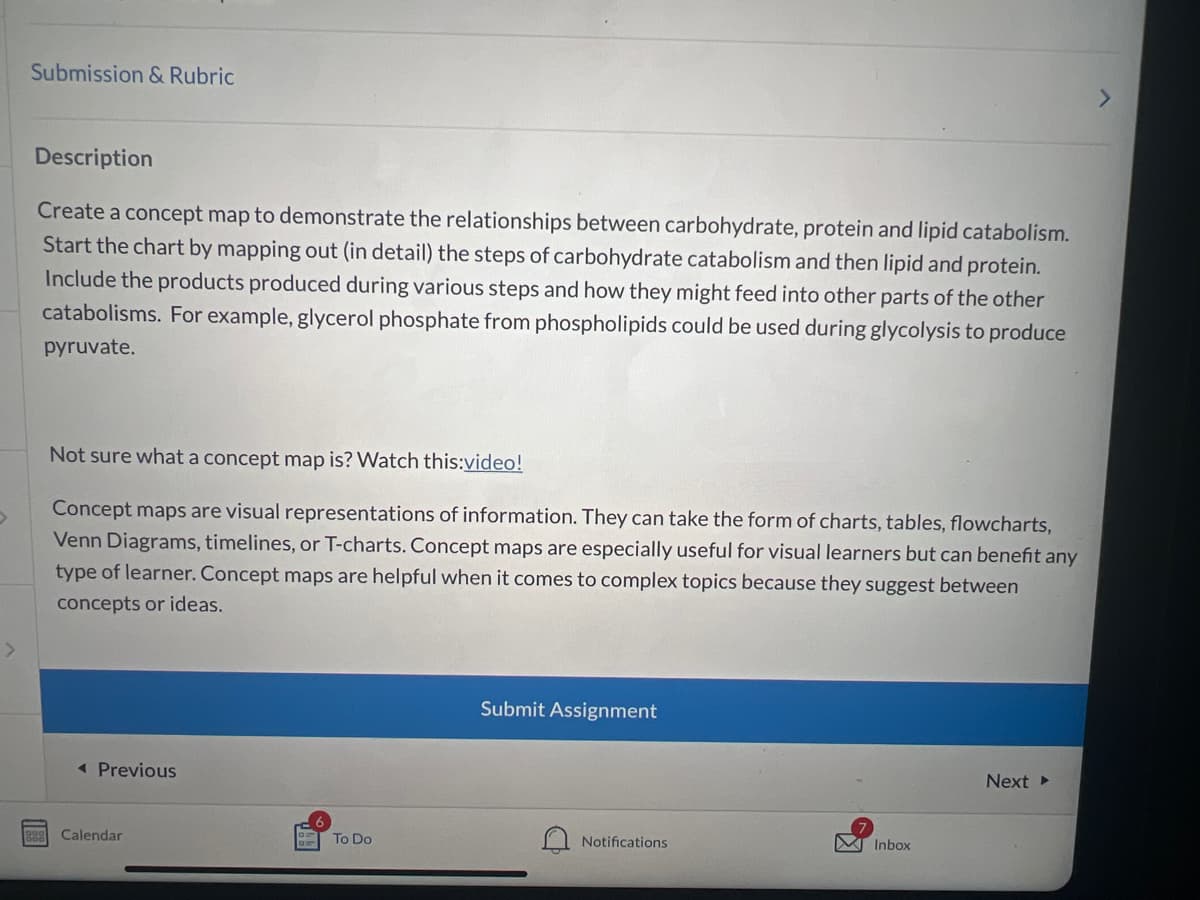
Create a concept map to demonstrate the relationships between carbohydrate, protein and lipid catabolism.
Start the chart by mapping out (in detail) the steps of carbohydrate catabolism and then lipid and protein.
Include the products produced during various steps and how they might feed into other parts of the other
catabolisms. For example, glycerol phosphate from phospholipids could be used during glycolysis to produce
pyruvate.
Not sure what a concept map is? Watch this:video!
Concept maps are visual representations of information. They can take the form of charts, tables, flowcharts,
Venn Diagrams, timelines, or T-charts. Concept maps are especially useful for visual learners but can benefit any
type of learner. Concept maps are helpful when it comes to complex topics because they suggest between
concepts or ideas.
◄ Previous
Calendar
To Do
Submit Assignment
Notifications
Inbox
Next ▸
Expert Solution
Step 1
Glycolysis is a metabolic process that occurs in the cytoplasm of cells, where glucose is converted into two molecules of pyruvate. The process involves a series of enzymatic reactions that break down glucose into smaller molecules and release energy in the form of ATP and NADH. Glycolysis is the first step in both aerobic and anaerobic cellular respiration, and is essential for the production of energy in the form of ATP.

Trending now
This is a popular solution!

Step by step
Solved in 2 steps with 1 images

Recommended textbooks for you
Understanding Nutrition (MindTap Course List)
Health & Nutrition
ISBN:
9781337392693
Author:
Eleanor Noss Whitney, Sharon Rady Rolfes
Publisher:
Cengage Learning
Understanding Nutrition (MindTap Course List)
Health & Nutrition
ISBN:
9781337392693
Author:
Eleanor Noss Whitney, Sharon Rady Rolfes
Publisher:
Cengage Learning