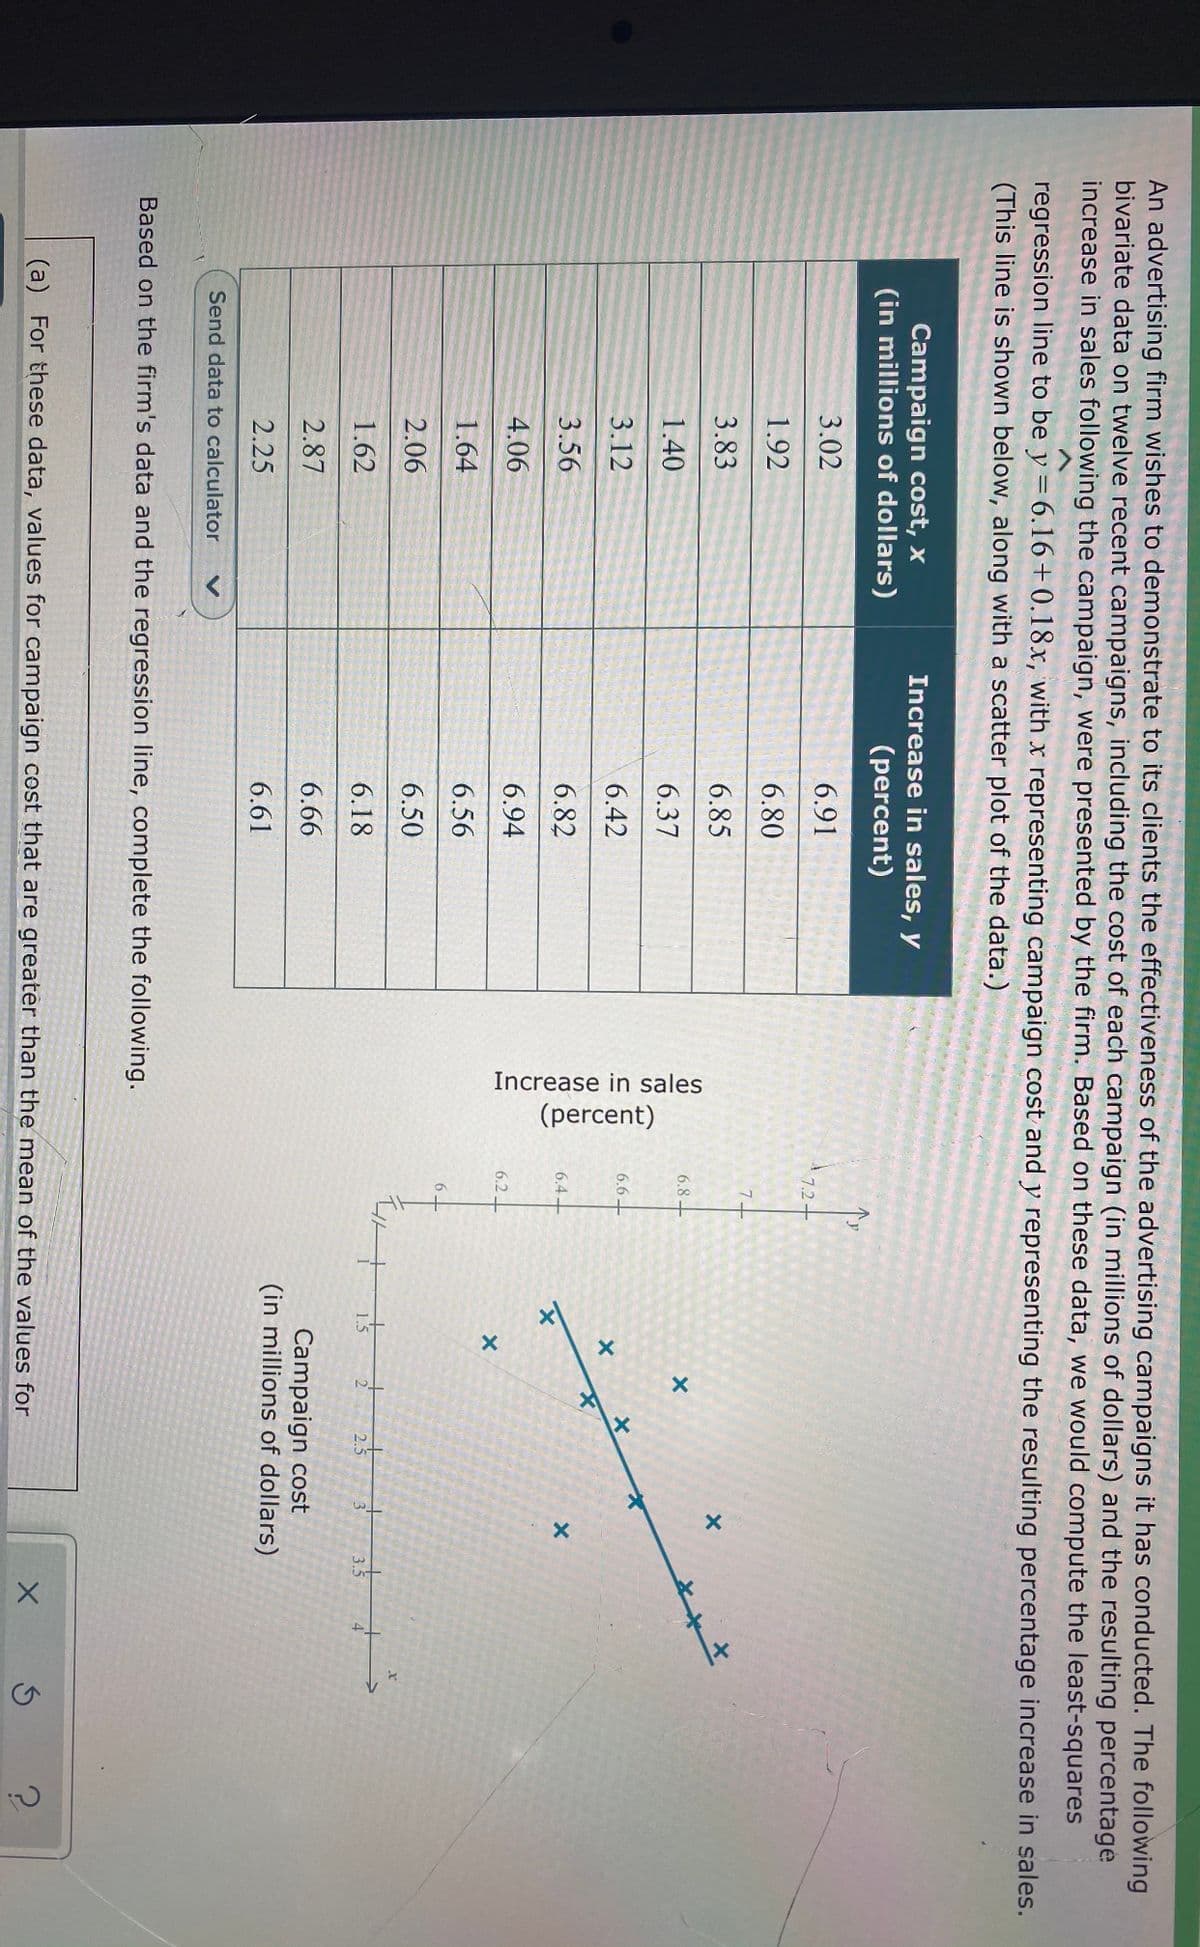
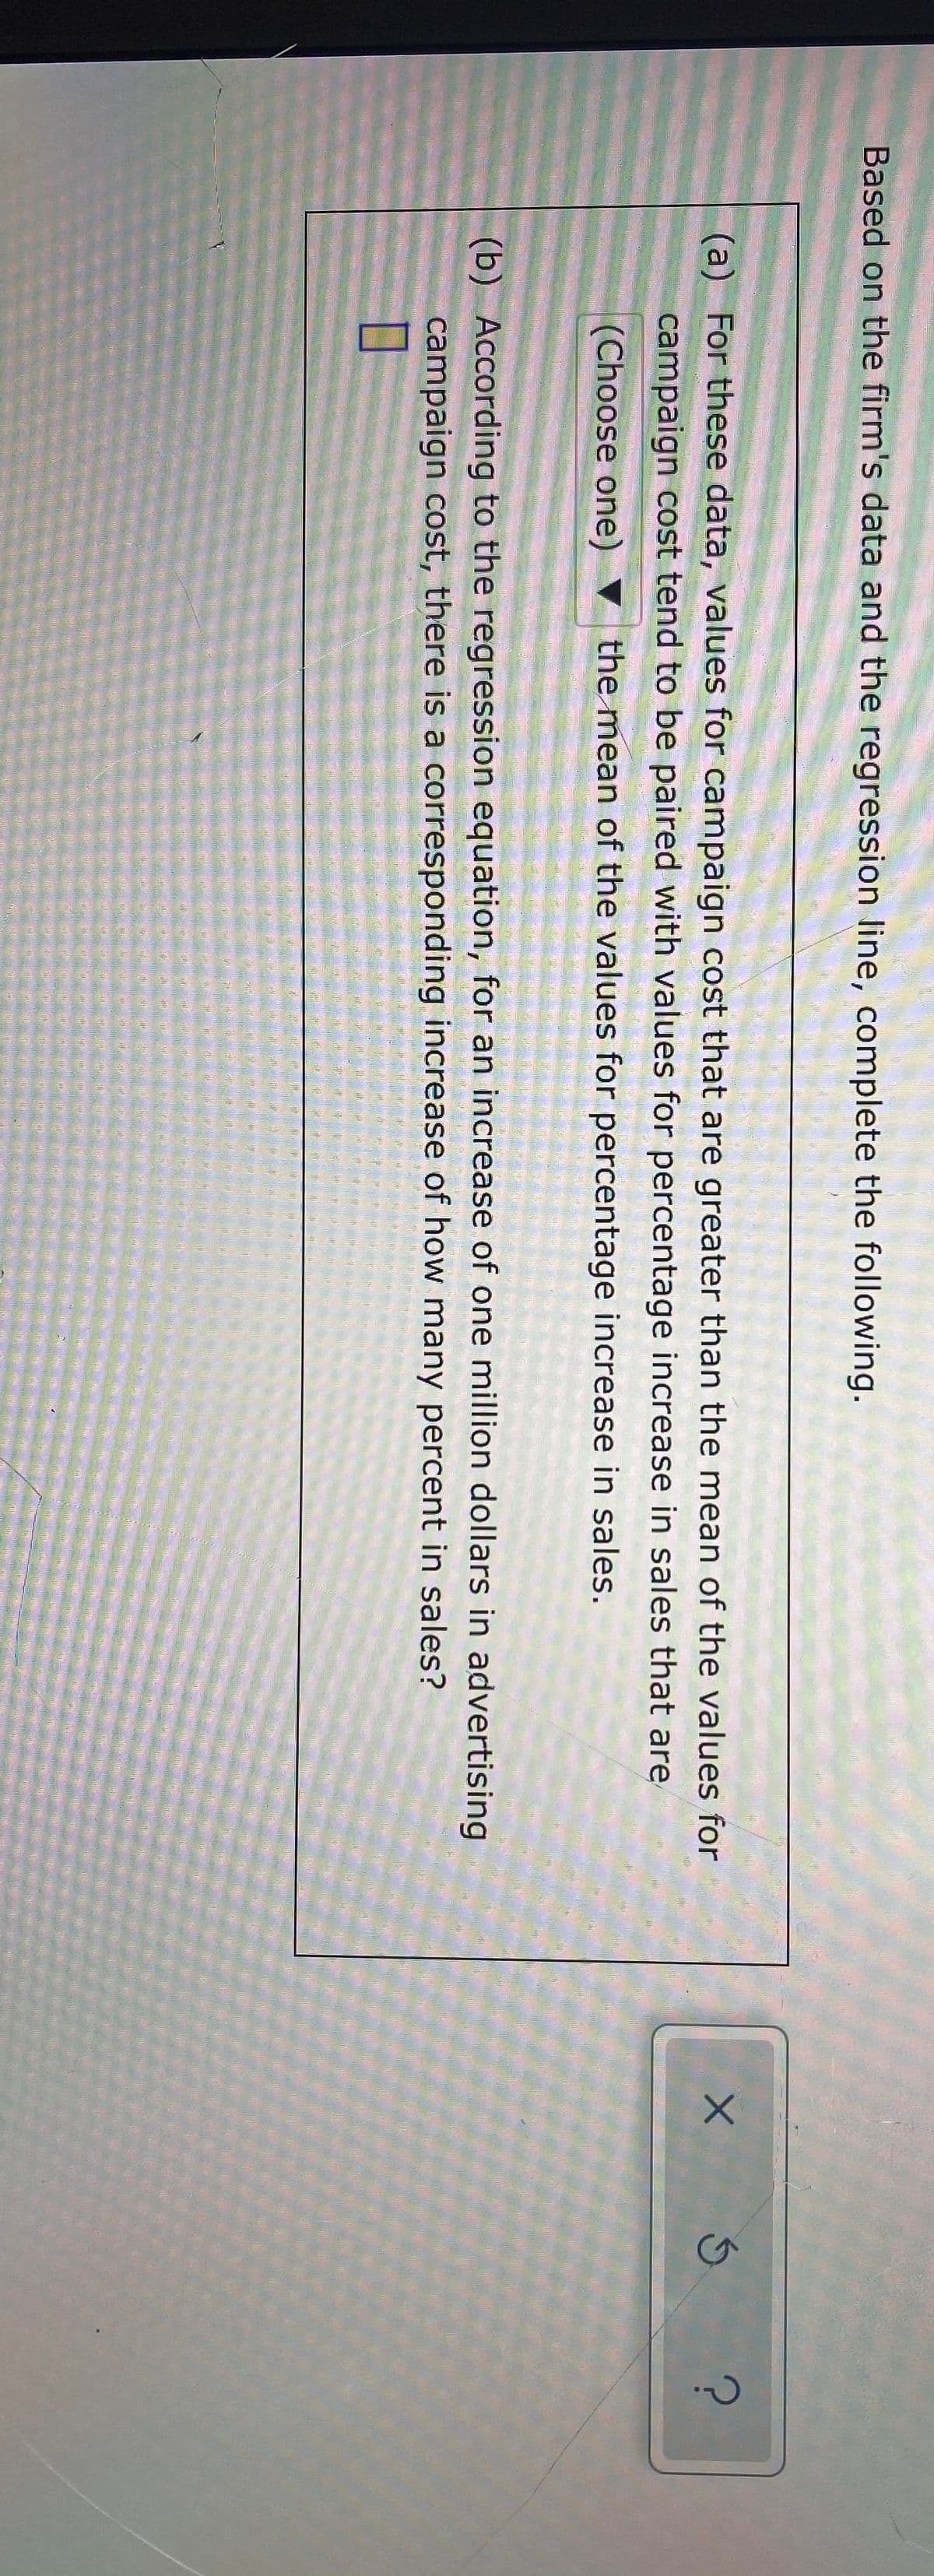
d on the firm's data and the regression line, complete the following. (a) For these data, values for campaign cost that are greater than the mean of the values for campaign cost tend to be paired with values for percentage increase in sales that are (Choose one) the mean of the values for percentage increase in sales. (b) According to the regression equation, for an increase of one million dollars in advertising campaign cost, there is a corresponding increase of how many percent in sales?


Correlation
Correlation defines a relationship between two independent variables. It tells the degree to which variables move in relation to each other. When two sets of data are related to each other, there is a correlation between them.
Linear Correlation
A correlation is used to determine the relationships between numerical and categorical variables. In other words, it is an indicator of how things are connected to one another. The correlation analysis is the study of how variables are related.
Regression Analysis
Regression analysis is a statistical method in which it estimates the relationship between a dependent variable and one or more independent variable. In simple terms dependent variable is called as outcome variable and independent variable is called as predictors. Regression analysis is one of the methods to find the trends in data. The independent variable used in Regression analysis is named Predictor variable. It offers data of an associated dependent variable regarding a particular outcome.


Trending now
This is a popular solution!

Step by step
Solved in 2 steps with 2 images


